This page relates to an older version 1.2 of Rich Filters::Service Desk Dashboards. See the documentation index for other versions.
The Rich Filter Date Bar Chart Gadget
Rich Filters::Service Desk Dashboards is an extension of the Rich Filters for Jira Dashboards app. This extension adds functionality specific to Jira Service Desk on top of the existing rich filters. If you are not already familiar with the rich filters, you should first have a look at the Rich Filters for Jira Dashboards documentation.
This page extends The Rich Filter Date Bar Chart Gadget page from the Rich Filters for Jira Dashboards documentation. If you're not sure how the Rich Filter Date Bar Chart gadget works, you should check that page first.
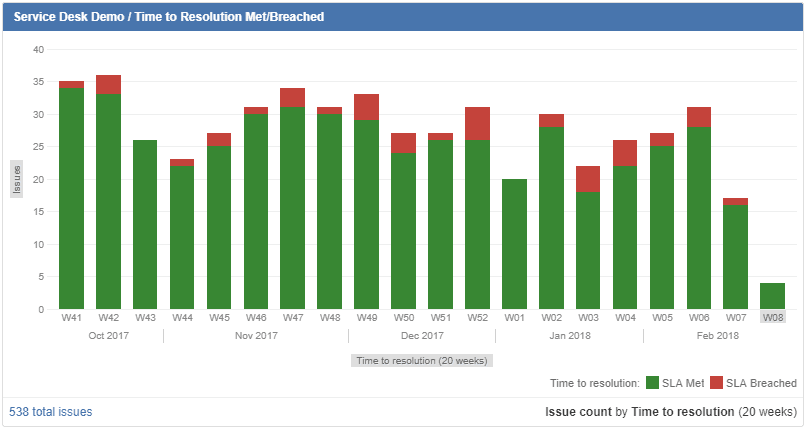
Rich Filters::Service Desk Dashboards provides new options for the Rich Filter Date Bar Chart gadget. You can now create bar charts based on the completion date of SLA fields and display the Met/Breached ratio for each time interval.
In order to configure these new features, the gadget provides new setting options:
| Setting | New options – description |
|---|---|
| Date Field | The user can select SLA fields in order to display bar charts based on the completion date of the SLA field. 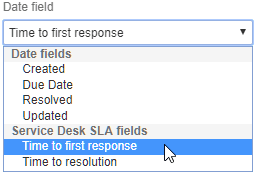 The Date Field list contains all the SLA fields. Each SLA option behaves like a date field representing the completion date of the last SLA cycle. The date bar chart will display only the issues which have their SLA completed. |
| Split Type | If the Date Field is an SLA, then a new Split Type becomes available – SLA Met/Breached. If this option is selected, then the date bar chart will display, for each time interval, the ratio between the issues with their SLA Met and the issues with their SLA Breached. 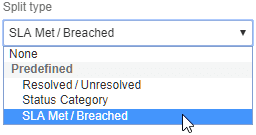 |