This page relates to an older version 1.2 of Rich Filters::Time Tracking Dashboards. See the documentation index for other versions.
The Rich Filter Pie Chart Gadget
Rich Filters::Time Tracking Dashboards is an extension of the Rich Filters for Jira Dashboards app. If you are not already familiar with the rich filters, you should first have a look at the Rich Filters for Jira Dashboards documentation.
This page extends The Rich Filter Pie Chart Gadget page from the Rich Filters for Jira Dashboards documentation. If you're not sure how the Rich Filter Pie Chart gadget works, you should check that page first.
Rich Filters::Time Tracking Dashboards adds new features to the Rich Filter Pie Chart gadget which allows you to build statistics based on work logs. If you're not sure how the filtering and grouping based on work log attributes works, you should first understand our Key Concepts.
After installing Rich Filters::Time Tracking Dashboards, you can use the Rich Filter Pie Chart gadget to:
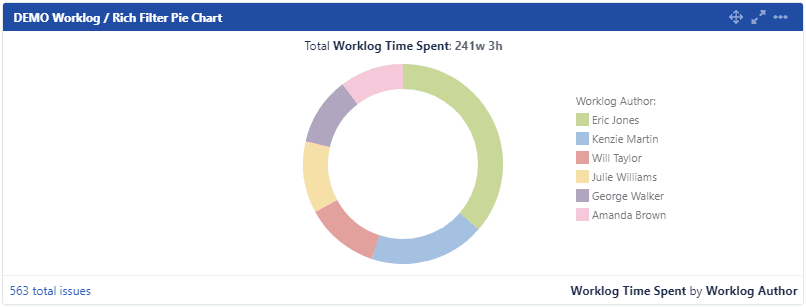
- display statistics based on the Worklog Author
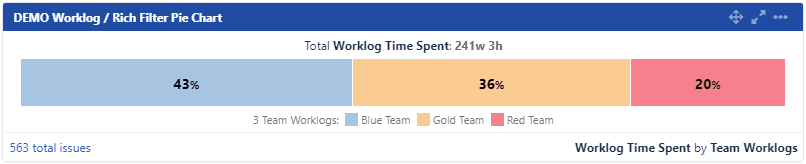
- display statistics based on custom worklog queries
In order to use the new features, the gadget provides new setting options:
| Setting | New options – description |
|---|---|
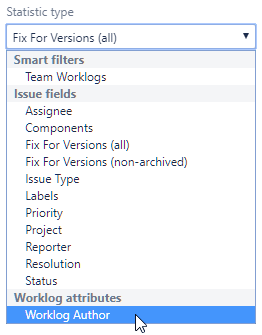
| Statistic Type | A new section called Worklog attributes is available which provides the Worklog Author statistic type.
Smart filters also can be used as statistic types. Rich Filters::Time Tracking Dashboards allows you to include worklog queries in your smart filter clauses in order to group work logs. See our Advanced Work Log Searching section to learn how to define custom work log queries. |
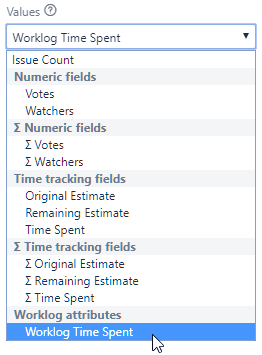
| Values | A new section called Worklog attributes is available for values based on work logs. The new section contains the Worklog Time Spent value.
|