This page relates to the Cloud version of Rich Filters for Jira Dashboards. Please see the documentation index for Server & Data Center versions.
Use rich filter counters and gauges in your dashboards
This article introduces you to the counter and gauges gadgets available in Rich Filters for Jira Dashboards. Counters sum values you are interested in (for example total issue count or story points), whereas gauges report proportions (for example the percentage of issues that have been resolved). Rich Filter Simple Counters gadgets and Rich Filter Simple Gauges gadgets are based on issue count or value fields such as story points or time spent. Rich Filter Smart Counters gadgets and Rich Filter Smart Gauges gadgets in addition use smart filters to split the values, as a custom breakdown.
Prerequisites
- A basic understanding of Jira dashboards and rich filters, as explained in Get started with Rich Filters for Jira Dashboards.
- A basic understanding of smart filters, as explained in Use custom smart filters and smart columns on your dashboard.
Final result for this tutorial
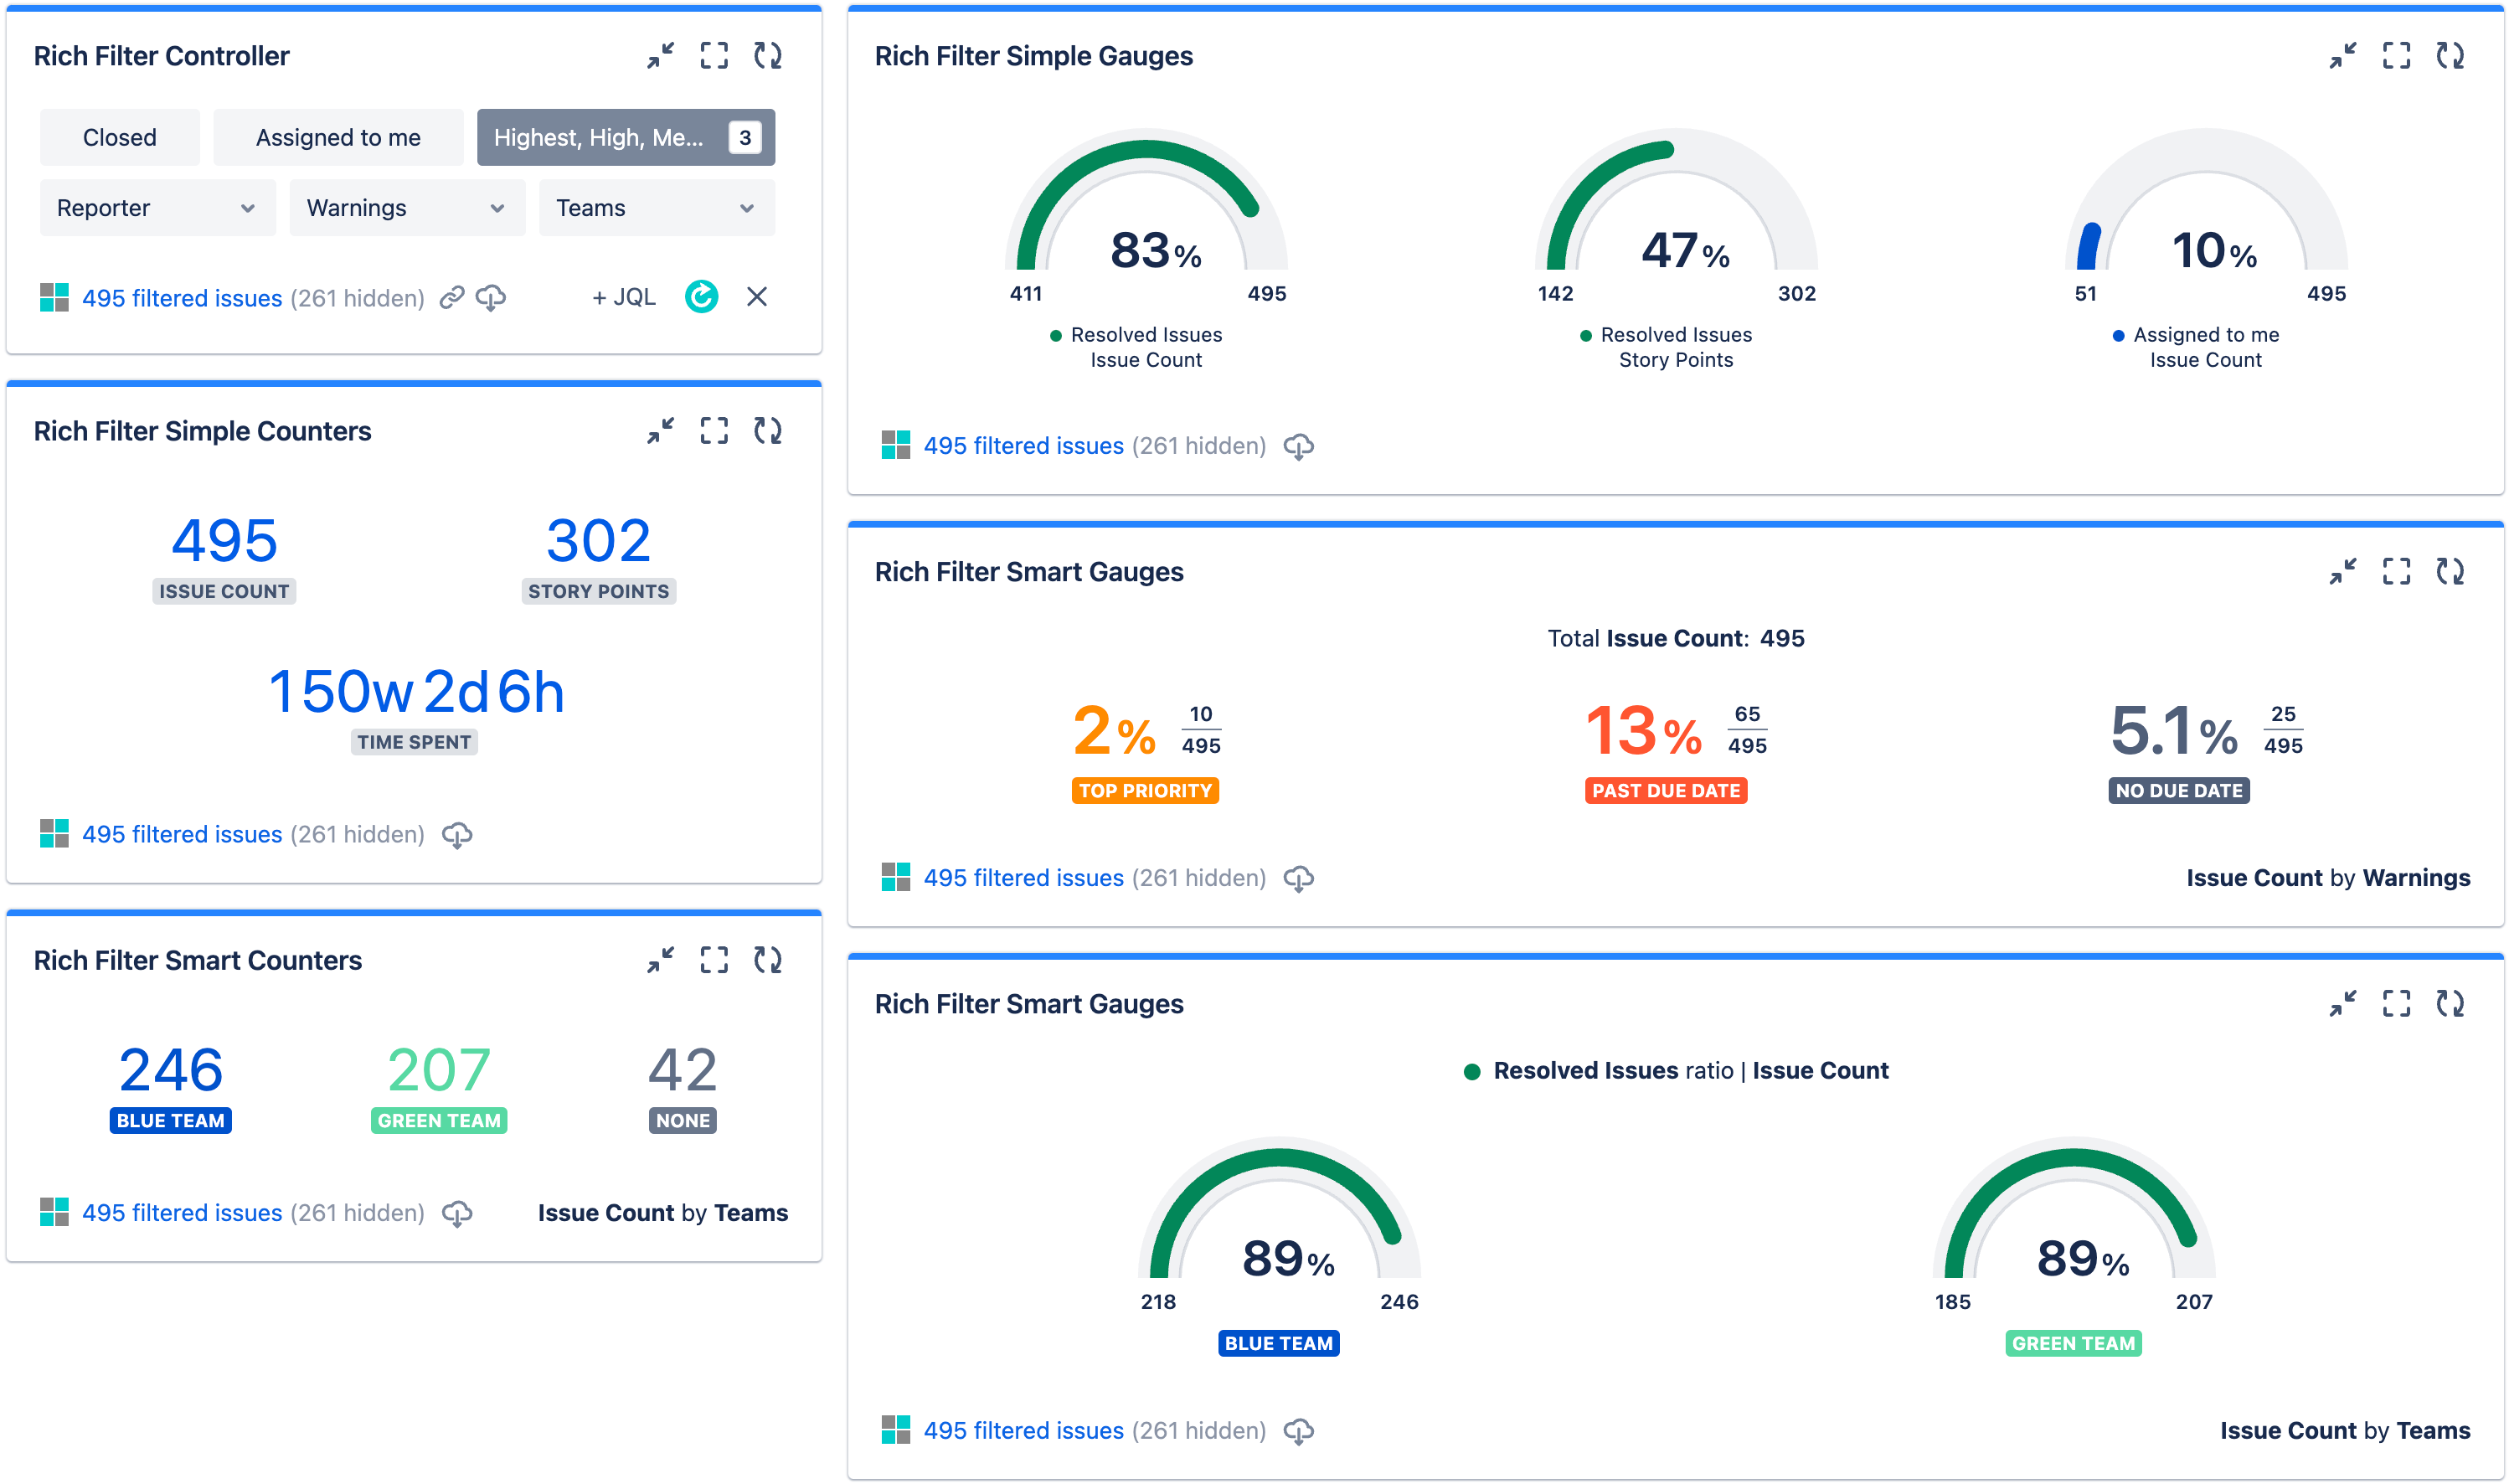
Once you've worked through the steps in this tutorial, you should have a dashboard that contains six rich filter gadgets:
- A Rich Filter Controller gadget containing some filters to provide interactive filtering across the entire dashboard.
- A Rich Filter Simple Counters gadget showing the total issue count, story points, and time spent.
- A Rich Filter Smart Counters gadget showing the number of issues assigned to different teams in the organization, and those not assigned to any team.
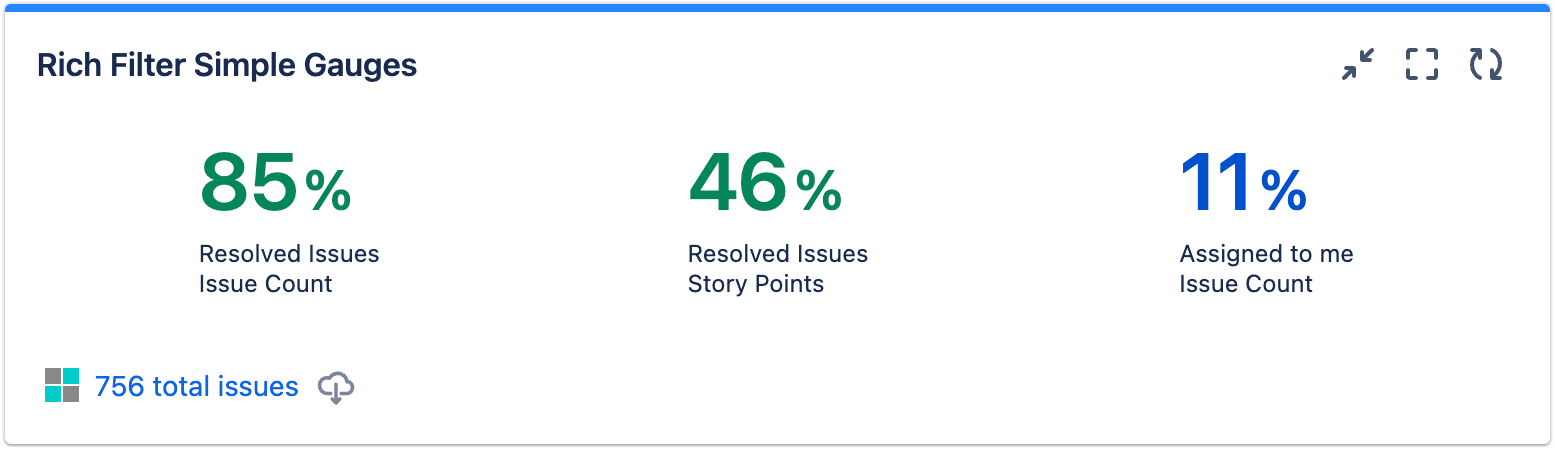
- A Rich Filter Simple Gauges gadget showing the proportion of issues that have been resolved (both in terms of the issue count and the story points value of those issues), and the proportion of issues assigned to the current user.
- A Rich Filter Smart Gauges gadget showing the proportion of issues that have assigned to them each of the custom warnings we defined as examples — Top priority, Past due date, and No due date.
- A second Rich Filter Smart Gauges gadget showing the proportion of resolved issues for each of our teams.
Rich filter and dashboard basic setup
In this section, you'll set up a basic rich filter and dashboard to work with.
- If you've already worked through other tutorials in this series, you can base any gadgets you create while following this article on a previously-created rich filter. Check that you have one available to use (find existing rich filters under Apps > Rich Filters). If not, follow the instructions in Get started with Rich Filters for Jira Dashboards to create a new rich filter before continuing.
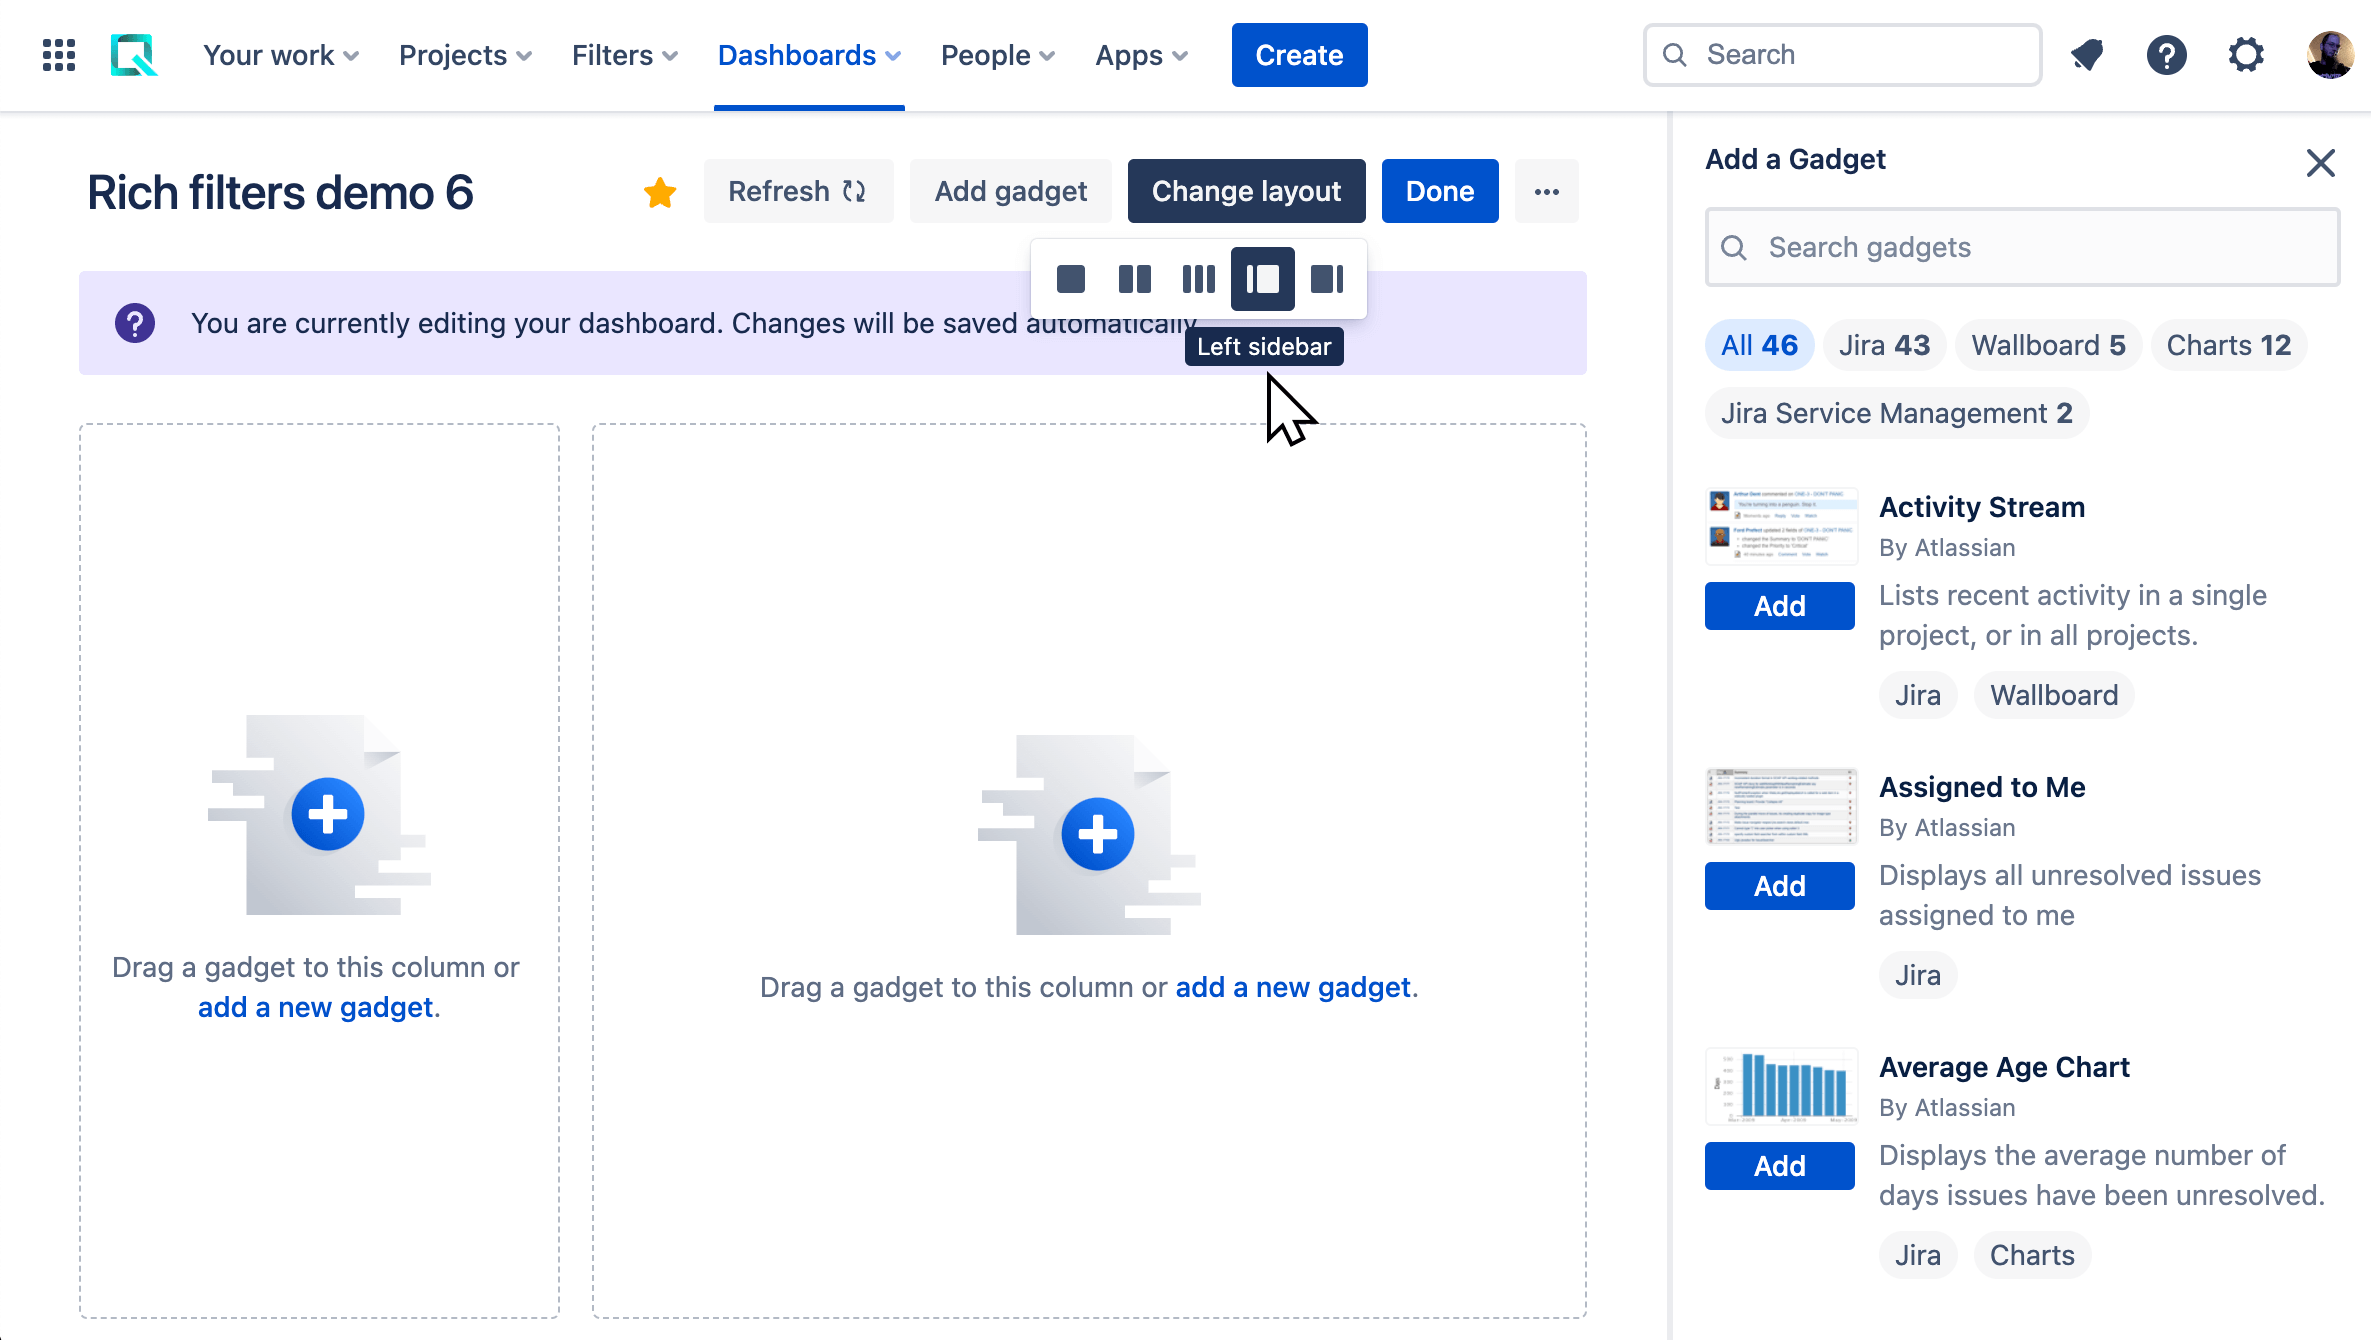
- Create a new dashboard (Dashboards > Create dashboard).
- Make sure it is using the Left sidebar layout. You can set this using the Change layout menu at the top of the dashboard.
- Add a Rich Filter Controller gadget to your dashboard based on your rich filter (Create a simple dashboard explains how to do this).
- After saving the configuration of your gadget, move the controller to the left-hand column of your dashboard if required, by dragging and dropping it.
If you want a more detailed explanation of creating a new dashboard, see Create a simple dashboard.
Add simple counters
Start off by adding a simple counter to your dashboard to summarize some core information about your issues. This can include issue count, sums of numeric or time-tracking fields, or even custom values (which we'll cover elsewhere).
- Add a Rich Filter Simple Counters gadget to your dashboard (Create a simple dashboard explains how to do this).
- Make sure your new gadget is in the left-hand column of your dashboard, underneath your controller; drag and drop it if needed.
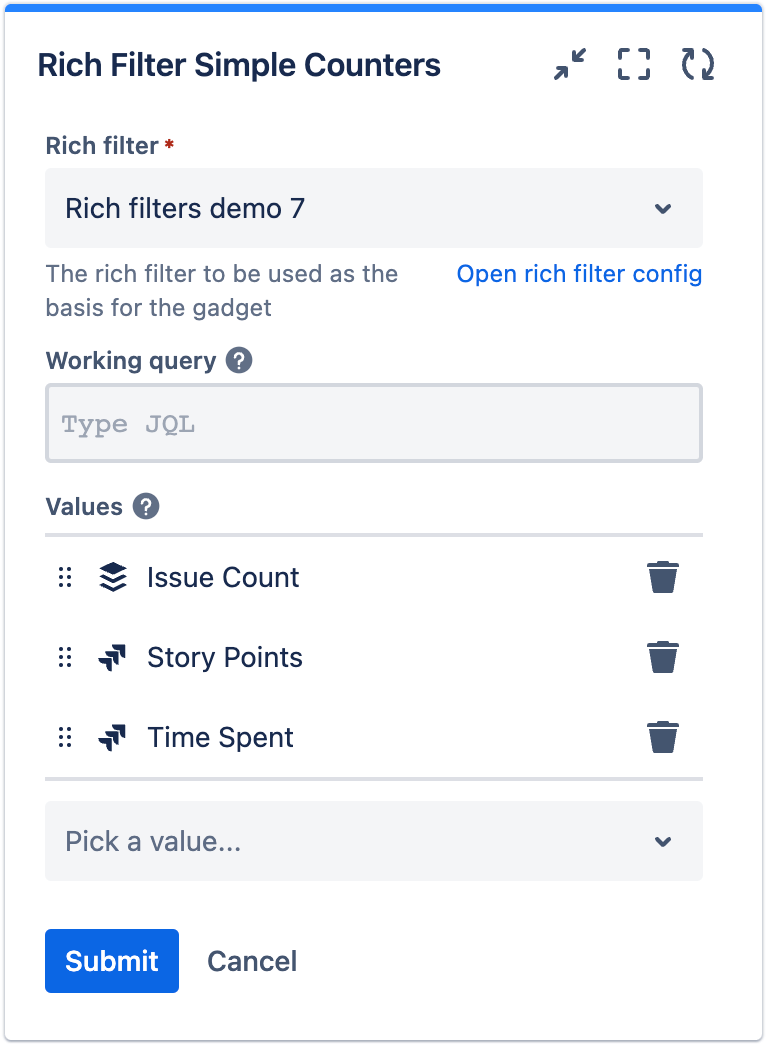
- In the gadget config form, set the different fields as follows:
- Rich filter: Set this to your rich filter.
- Values: From the Pick a value... dropdown, select Issue Count, Story Points, and Time Spent.
- Your config form should look like the following. Check that it is correct, then click Submit.
- Your Rich Filter Simple Counters gadget should look like this:
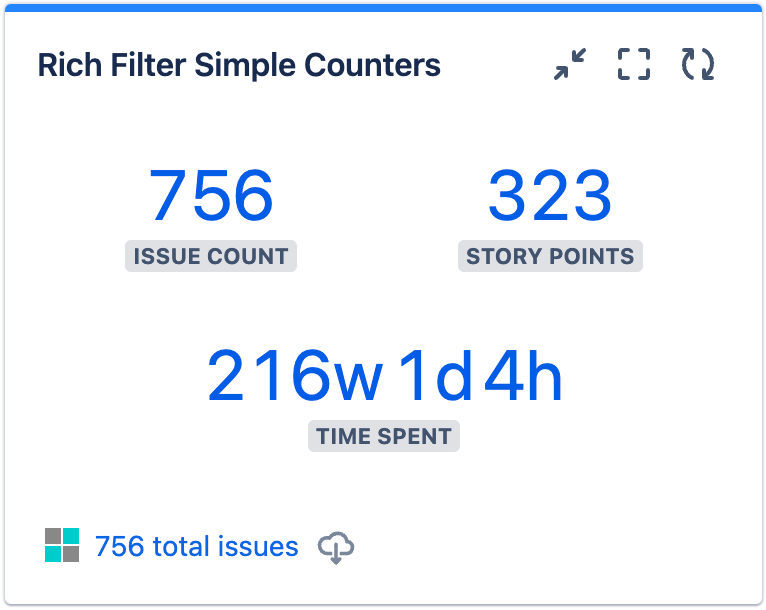
You can click on any value shown in a counters gadget to open up a new browser tab containing a list of all the Jira issues contributing to that value.
Add simple gauges
Next, let's add a set of simple gauges to report success in hitting work targets. A gauge computes a proportion from a total, for example, the proportion of issues resolved. The proportions shown in simple gauges can be derived from issue count, numeric or time-tracking fields, or custom values and custom ratios (we'll cover custom values and custom ratios elsewhere).
- Add a Rich Filter Simple Gauges gadget to your dashboard (Create a simple dashboard explains how to do this).
- Make sure your new gadget is in the right-hand column of your dashboard; drag and drop it if needed.
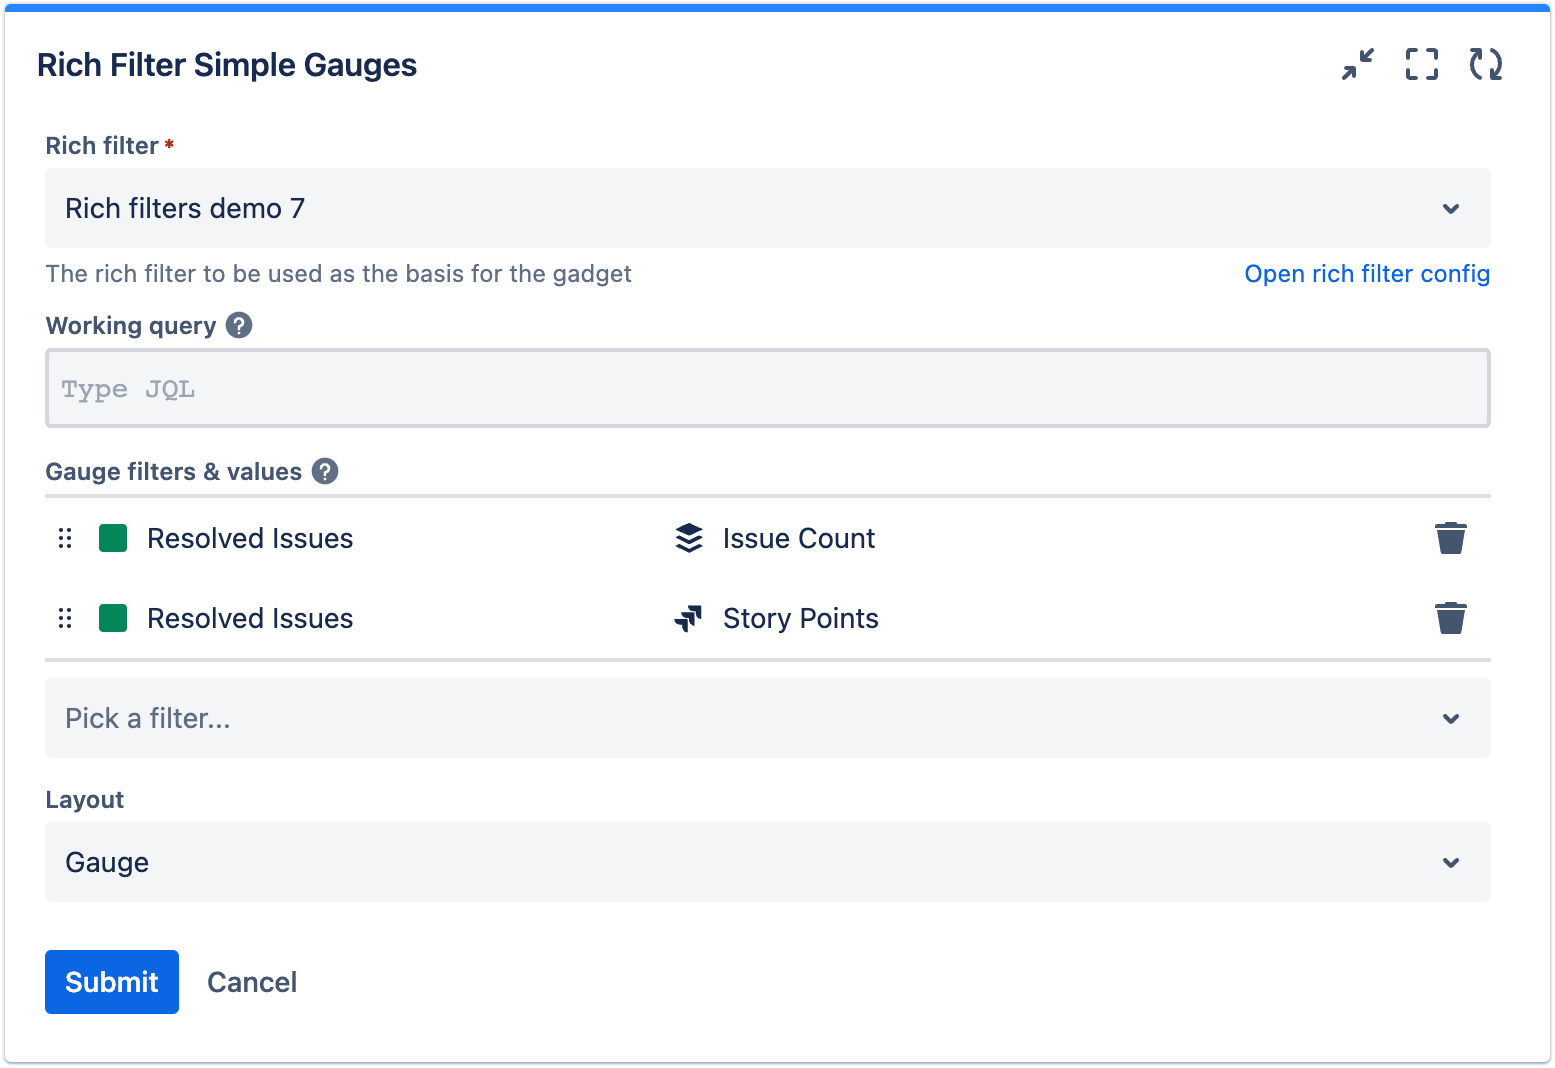
- In the gadget config form, set the different fields as follows:
- Rich filter: Set this to your rich filter.
- Gauge filters and values: To configure a simple gauge, you need to select a filter (either predefined or static) and a value. The filter returns the issues that contribute to the gauge level. The value is used to aggregate issues when computing the gauge level, gauge total, and their ratio. So for example, you might want to show the resolved story points as a proportion of the total story points. For this example, we'll use one of the predefined filters that come with rich filters.
- From the Pick a filter... dropdown, select Resolved Issues.
- From the Pick a value... dropdown that appears next to the first dropdown, select Issue Count.
- Create a second gauge — this time select Resolved Issues from Pick a filter..., and Story Points from Pick a value...
- Your config form should look like the following. Check that it is correct, then click Submit.
- Your Rich Filter Simple Gauges gadget should look like this:
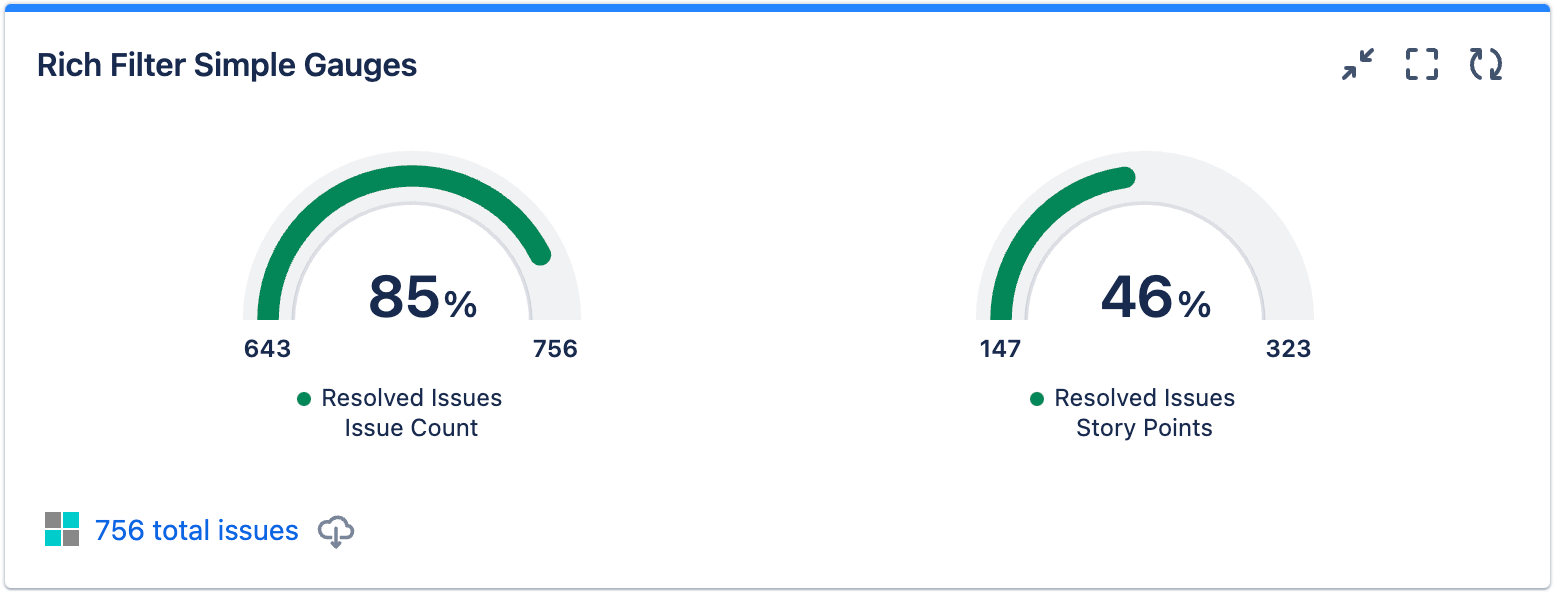
You will see that by default, the gauges display the percentage of the gauge level from the gauge total, and the gauge level and total as numeric values, in a gauge graphic format. So in our cases:
- The percentage of resolved issues, the number of resolved issues, and the total number of issues.
- The percentage of resolved story points, the number of resolved story points, and the total story points.
You can also base a simple gauge on a static filter that you've created. Let's say you want to create a gauge that shows the proportion of issues assigned to you.
- Open your rich filter config (as described in Easier configuration with the Rich filter menu).
- Go to the Static Filters tab and check whether you have the Assigned to me static filter available.
- If you don't already have Assigned to me, create it as described in Add some static filters to your controller.
- Go back to your dashboard and refresh it.
- Return to your Rich Filter Simple Gauges gadget config form (as described in Easier configuration with the Rich filter menu).
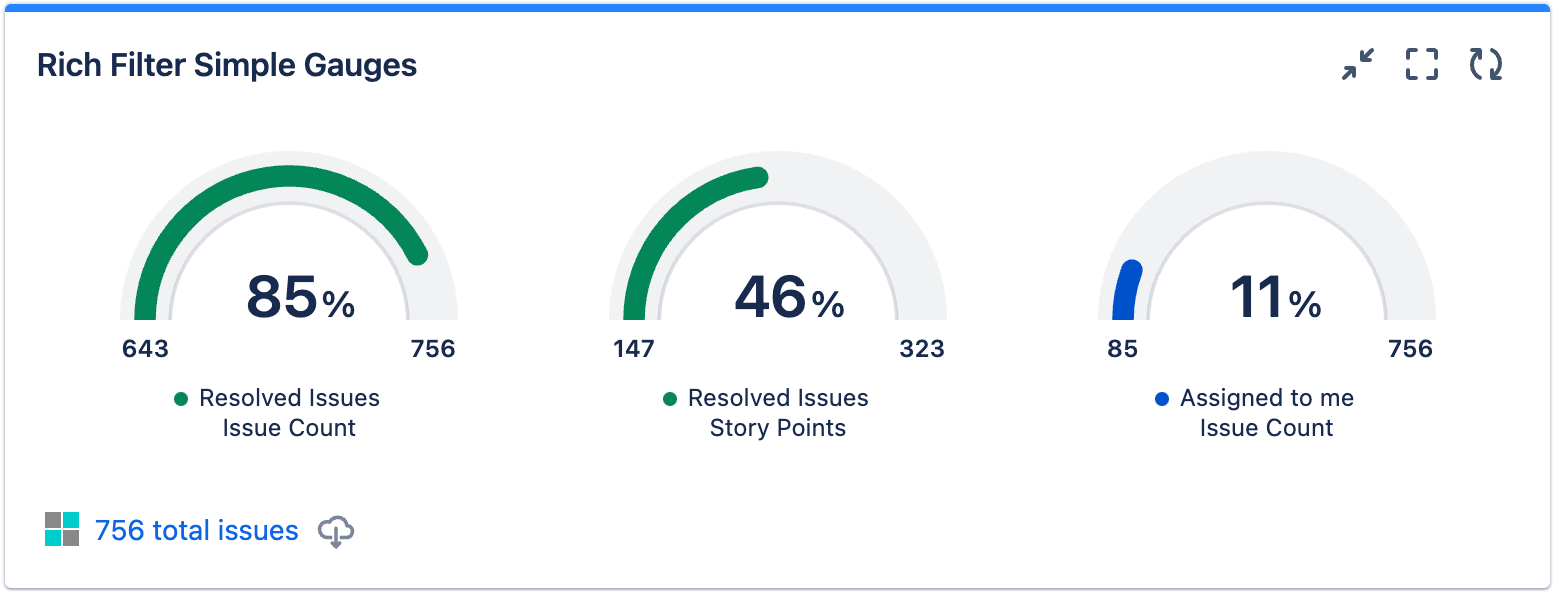
- Create a third gauge — this time select your Assigned to me static filter from Pick a filter..., and Issue Count from Pick a value...
- Click Submit.
You should now have a gauge based on your static filter. Note how its color matches the color set for the static filter in the rich filter config, and that the predefined Resolved Issues filter has a predefined green color.
You can click on any value shown in a gauges gadget (percentage or number) to open up a new browser tab containing a list of all the Jira issues contributing to that value.
Change the gauge layout
There are three different layout options for simple gauges, available in the Layout dropdown at the bottom of the gadget config form.
- Gauge: The default, which we have been using so far. This shows the percentage of the gauge level from the gauge total, and the gauge level and total, in a gauge graphic format.
- Percentage and fraction: This shows the percentage of the gauge level from the gauge total, and the gauge level and total as a fraction.
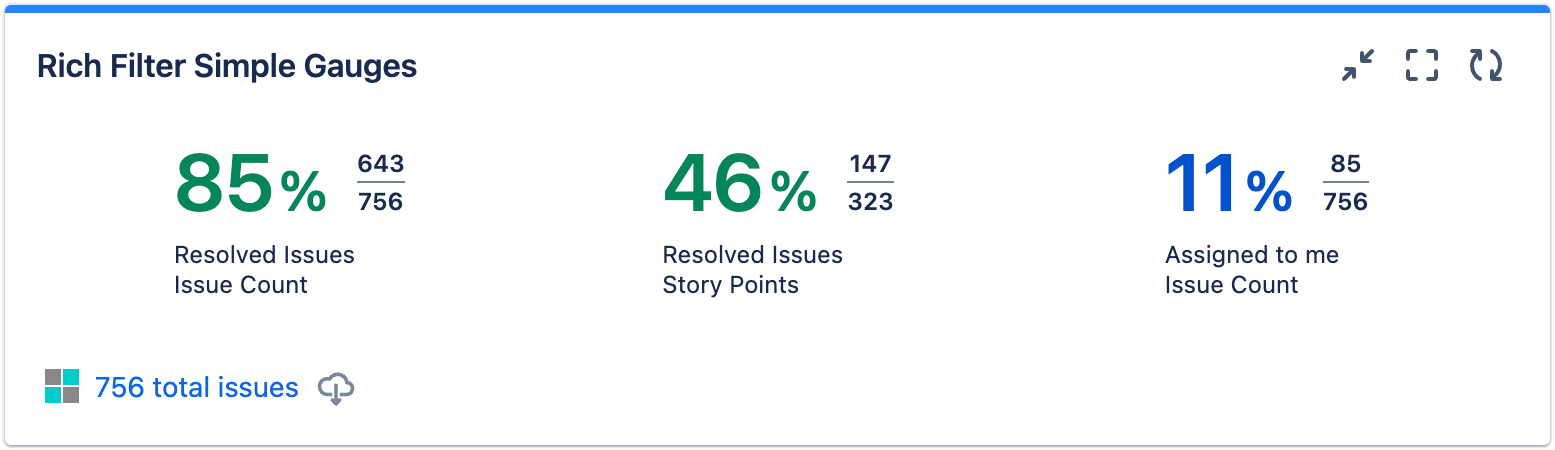
- Percentage only: This shows only the percentage of the gauge level from the gauge total.
Have a play with these options now, and choose the one you like best:
- Return to your Rich Filter Simple Gauges gadget config form.
- Choose a new value from the Layout dropdown.
- Click Submit to see your new layout.
Add smart counters
Let's look at the smart versions of the two gadgets we looked at above, starting with the Rich Filter Smart Counters gadget. As mentioned earlier, the values this gadget displays are split by a smart filter, as a custom breakdown. We'll display a count of the issues assigned to the different teams defined by the Teams smart filter we saw earlier in the article series.
First, let's make sure you have the Teams smart filter available:
- Open your rich filter config (as described in Easier configuration with the Rich filter menu).
- Go to the Smart Filters tab.
- If you don't already have it available, create the Teams smart filter as described in Create a Teams smart filter.
- Go back to your dashboard and refresh it.
Now let's add a counter to summarize our Team issue counts:
- Add a Rich Filter Smart Counters gadget to your dashboard (Create a simple dashboard explains how to do this).
- Make sure your new gadget is in the left-hand column of your dashboard, underneath your Rich Filter Simple Counters gadget; drag and drop it if needed.
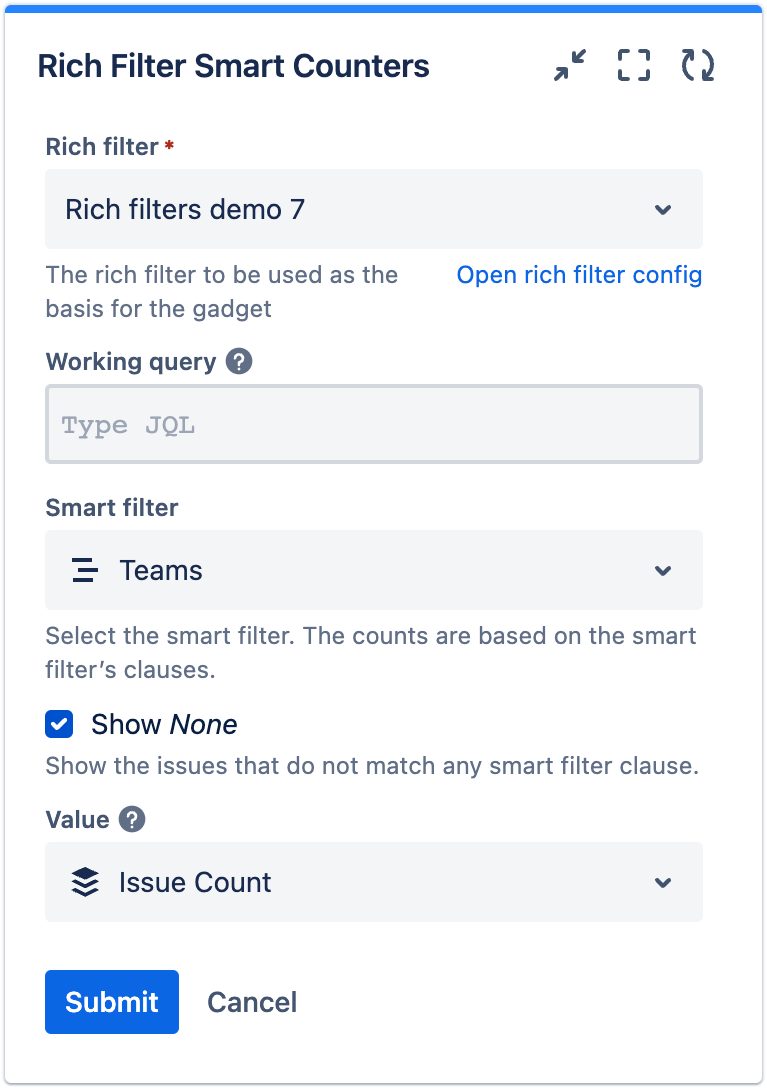
- In the gadget config form, set the different fields as follows:
- Rich filter: Set this to your rich filter.
- Smart filter: Choose your Teams smart filter.
- Show None: This checkbox controls whether a count is shown for issues that don't match any smart filter clause. Keep this box checked — it is useful to monitor how many issues aren't assigned to any team.
- Value: Choose Issue Count.
- Your config form should look like the following. Check that it is correct, then click Submit.
- Your Rich Filter Smart Counters gadget should look like this:
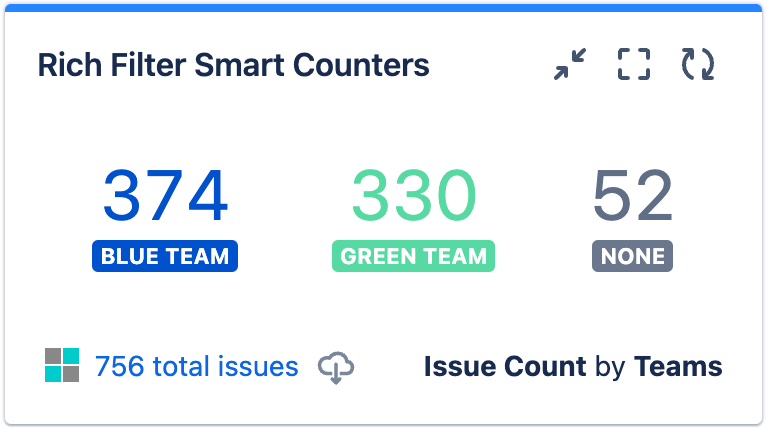
Note how the gadget shows a count of the issues matched by each smart clause in the smart filter, with each one also matching the smart clause's label and color.
Add smart gauges
In a similar fashion to smart counters, smart gauges always use a smart filter to provide a custom breakdown. In this section, you'll add a Rich Filter Smart Gauges gadget showing the percentage of issues that have different custom warnings, defined by the Warnings smart filter we saw earlier in the article series.
- If you don't already have the Warnings smart filter available, add it to your rich filter as described in Add a smart filter to your controller.
- Add a Rich Filter Smart Gauges gadget to your dashboard (Create a simple dashboard explains how to do this).
- Make sure your new gadget is in the right-hand column of your dashboard, underneath your Rich Filter Simple Gauges gadget; drag and drop it as needed.
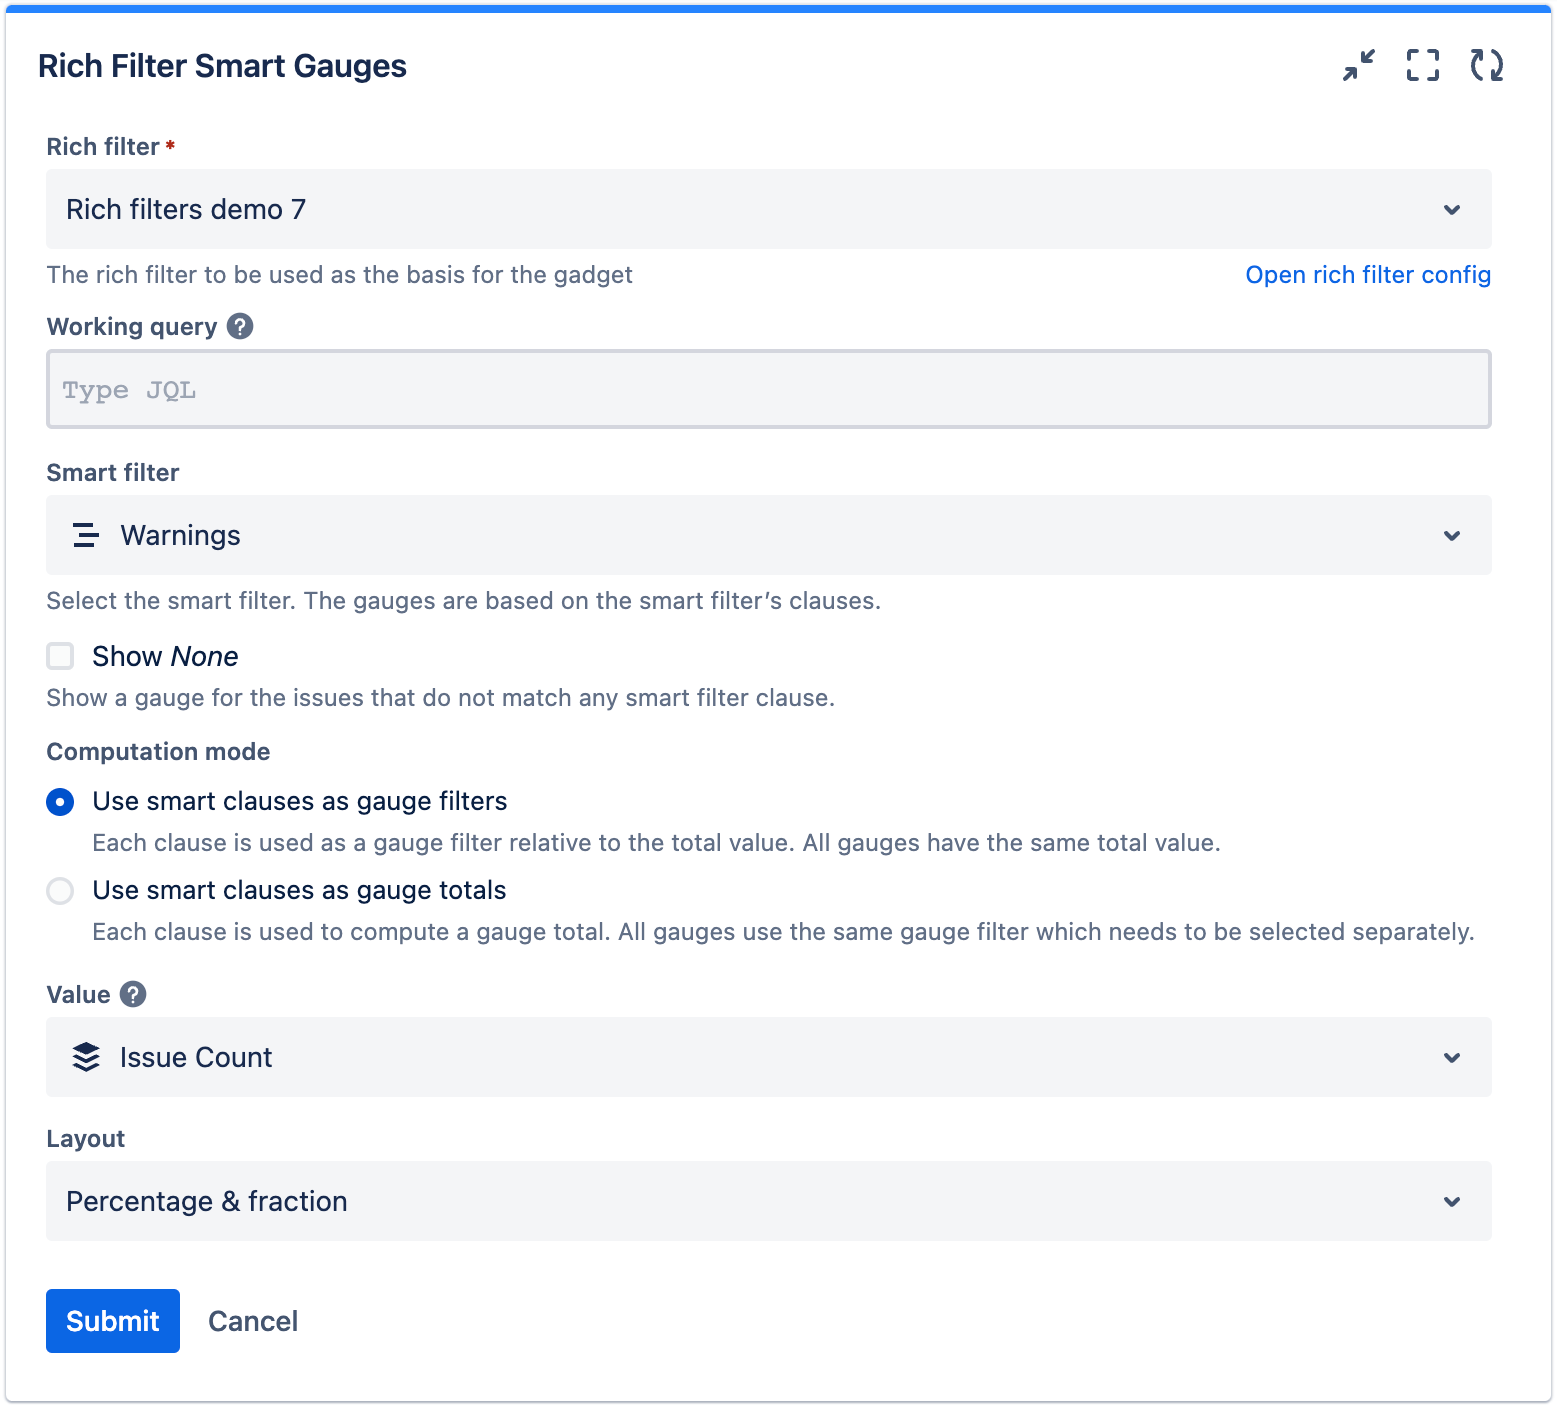
- In the gadget config form, set the different fields as follows:
- Rich filter: Set this to your rich filter.
- Smart filter: Choose your Warnings smart filter.
- Show None: This checkbox controls whether a gauge is shown for issues that don't match any smart filter clause. Uncheck this box.
Computation mode: Keep the Use smart clauses as gauge filters radio button selected — this option creates a gauge for each smart clause showing the percentage of issues matching the smart clause (gauge level) from all the issues included in the gadget (gauge total). As a result, each gauge has the same total. The values are computed based on the Value field selection (the field below this one). In this case, we are showing the percentage of issues that have each warning applied to them.
The other Computation mode value — Use smart clauses as gauge totals — also creates a gauge for each smart clause. In this case, however, each gauge's total is based on the total number of issues that match the smart clause, and you have to choose a filter that you want to show a proportion of in each gauge (for example number of issues resolved). You'll see an example of this in the next section.
- Value: Choose Issue Count.
- Layout: Choose Percentage & fraction.
- Your config form should look like the following. Check that it is correct, then click Submit.
- Your Rich Filter Smart Gauges gadget should look like this:
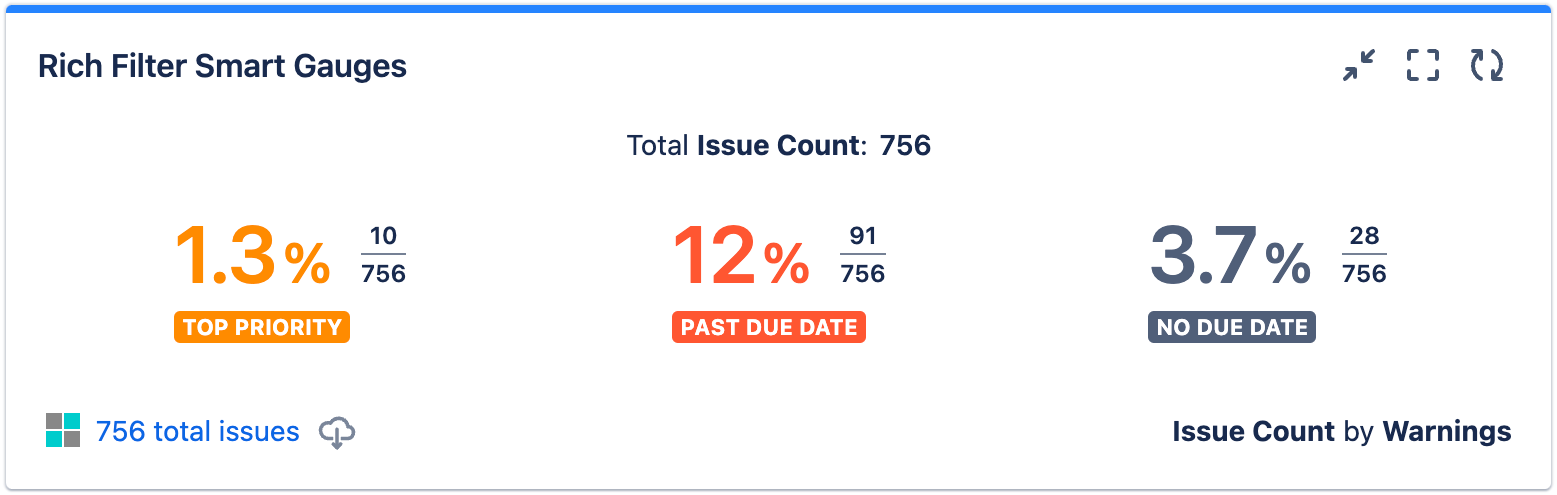
This gadget shows a percentage of the issues that match each smart clause, as well as the actual number of matching issues and total number of issues in each case.
Explore the second smart gauges computation mode
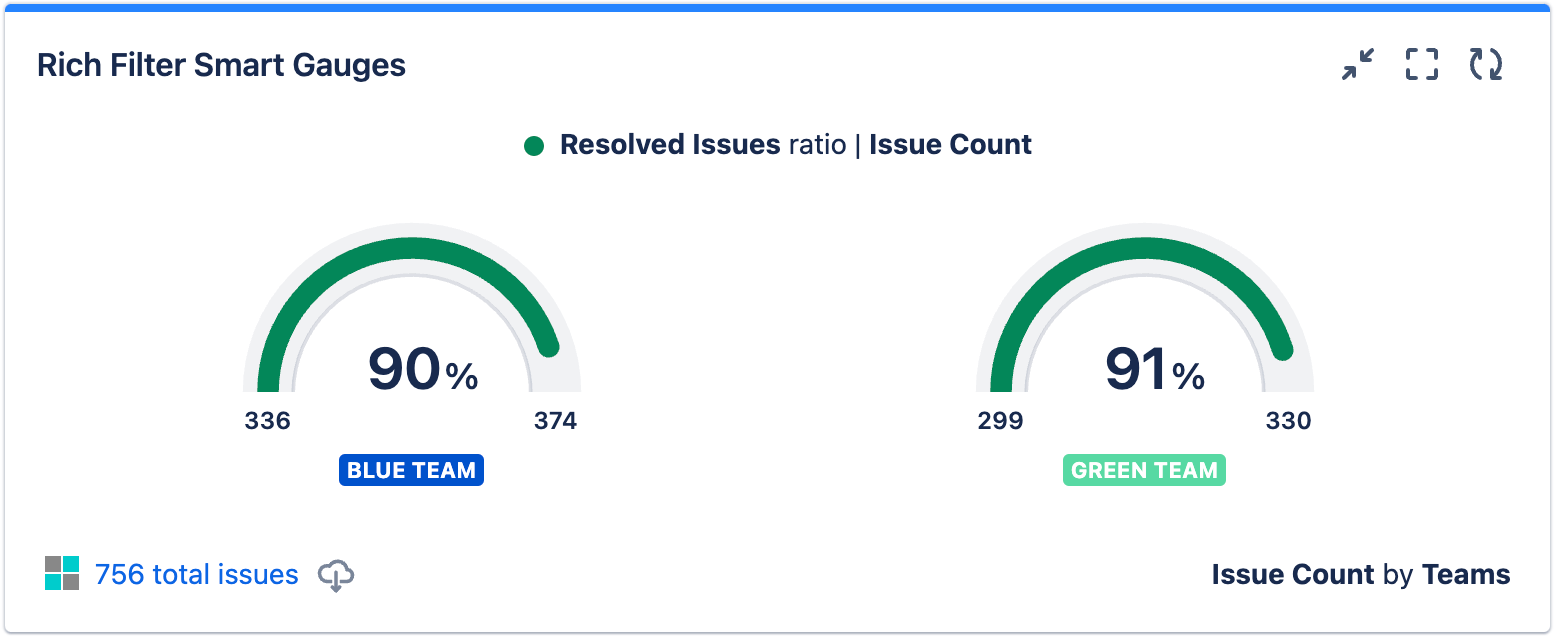
In this section, you'll add another Rich Filter Smart Gauges gadget, this time based on the Teams smart filter, showing what proportion of issues each team has managed to resolve. This time you'll use the second smart gauges computation mode, and explore the difference between the two.
- Add another Rich Filter Smart Gauges gadget to your dashboard, below the previous one, in the right-hand column.
- Use the following values in the config form:
- Rich filter: Set this to your rich filter.
- Smart filter: Choose your Teams smart filter.
- Show None: Uncheck this box.
Computation mode: Select the Use smart clauses as gauge totals radio button
- Gauge filter and value: Choose Resolved Issues from Pick a filter..., and Issue Count from the Value... dropdown.
- Click Submit.
Your new gadget should look like so:
Have a look at your two Rich Filter Smart Gauges gadgets and observe the difference between the first and second computation modes:
- In the first example, which uses the first mode, you are showing the percentage of issues that match each smart clause, out of the total number of issues available. The smart clauses determine the gauge levels in this case.
- In the second example, which uses the second mode, you are showing the percentage of resolved issues from the issues assigned to each team. In this case, the smart clauses determine the total for each gauge, and you had to select a separate filter (Resolved Issues) to derive the proportion from.
Further exercises
To complete this tutorial, we'd like you to add some dynamic filters to your controller as explained in Enhance your Jira dashboards with dynamic filters, and explore how they can be used to further filter the information shown in your counters and gauges gadgets.
You don't need a lot of dynamic filters for this example, and you should take care to choose ones that make sense to apply alongside the existing filtering already happening inside the counters and gauge gadgets. Priority and Reporter are reasonable choices. Try applying some filters in your controller, and take note of the effect they have on your other gadgets.