This page relates to the Cloud version of Rich Filters for Jira Dashboards. Please see the documentation index for Server & Data Center versions.
Use custom values in your dashboards
Rich Filters for Jira Dashboards allows you to define custom values — advanced user-defined values that can be used in rich filter gadgets. They provide the ability to use custom formulas (sum, average, minimum, and maximum) when aggregating values, custom display options for the results including label, color, and format, and JQL for further filtering. Custom values are available as columns in views and values in gadgets, alongside Jira fields.
Prerequisites
- A basic understanding of Jira dashboards and rich filters, as explained in Get started with Rich Filters for Jira Dashboards.
- A basic understanding of Jira Query Language (JQL).
Final result for this tutorial
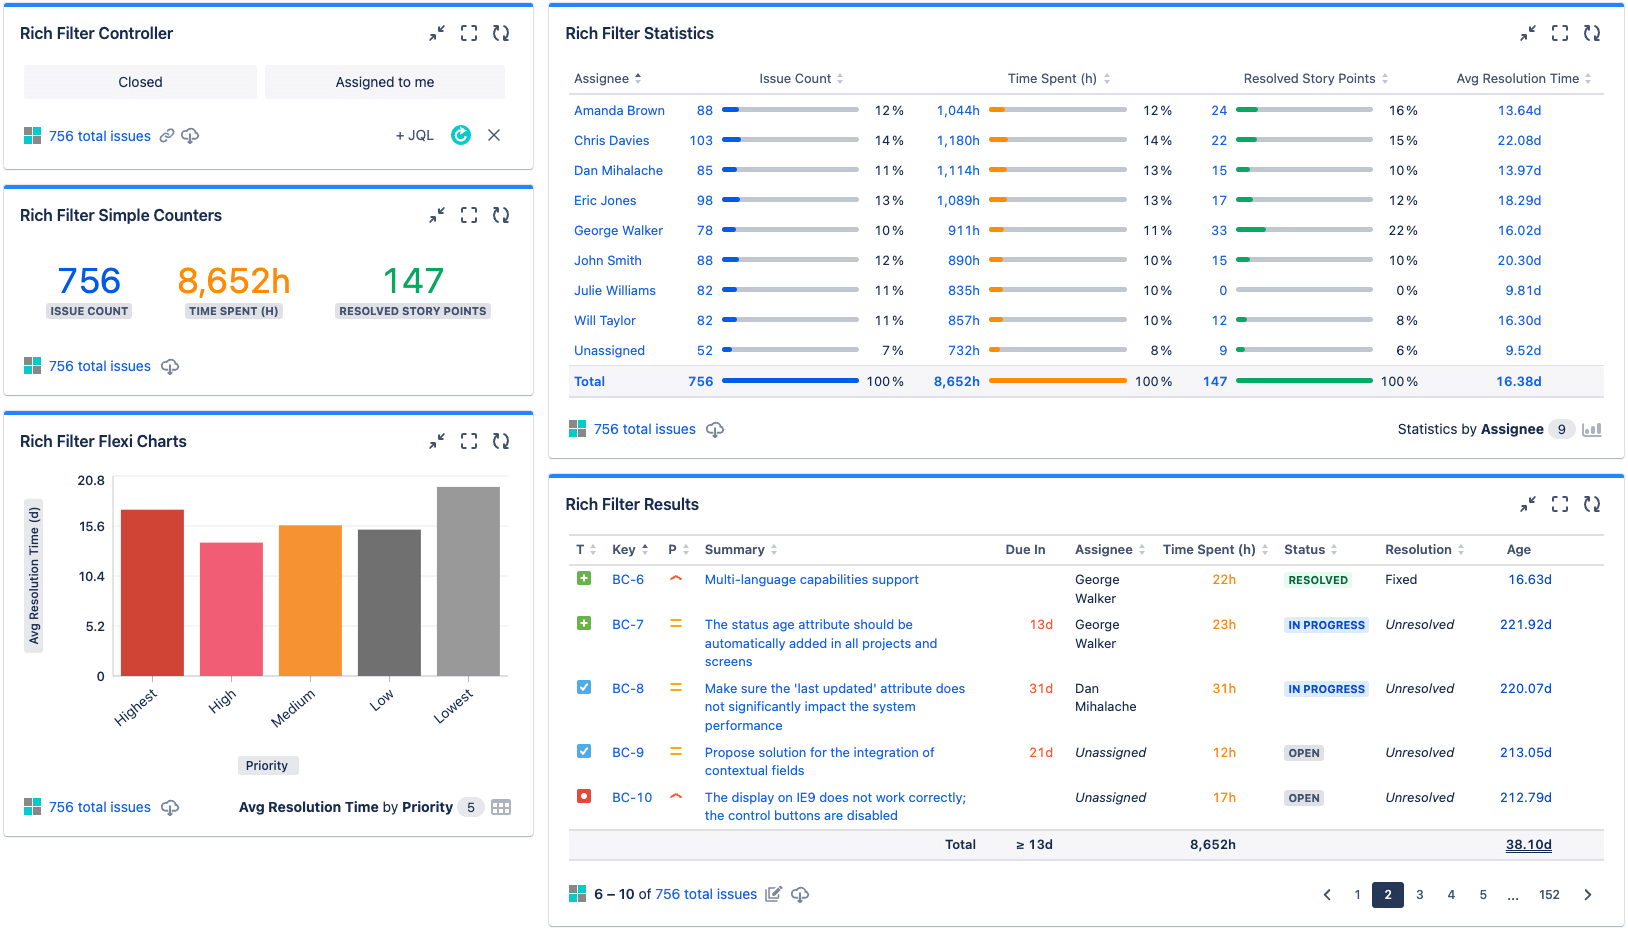
Once you've worked through the steps in this tutorial, you should have a dashboard that contains five rich filter gadgets:
- A Rich Filter Controller gadget to provide interactive filtering of your dashboard.
- A Rich Filter Simple Counters Gadget to sum custom values.
- A Rich Filter Flexi Charts gadget based on custom values.
- A Rich Filter Statistics gadget based on custom values.
- A Rich Filter Results gadget showing custom value-based columns in action.
Rich filter and dashboard basic setup
In this section, you'll set up a basic rich filter and dashboard to work with.
- If you've already worked through other tutorials in our Learning Center, you can base any gadgets you create while following this article on a previously-created rich filter. Check that you have one available to use (find existing rich filters under Apps > Rich Filters). If not, follow the instructions in Get started with Rich Filters for Jira Dashboards to create a new rich filter before continuing.
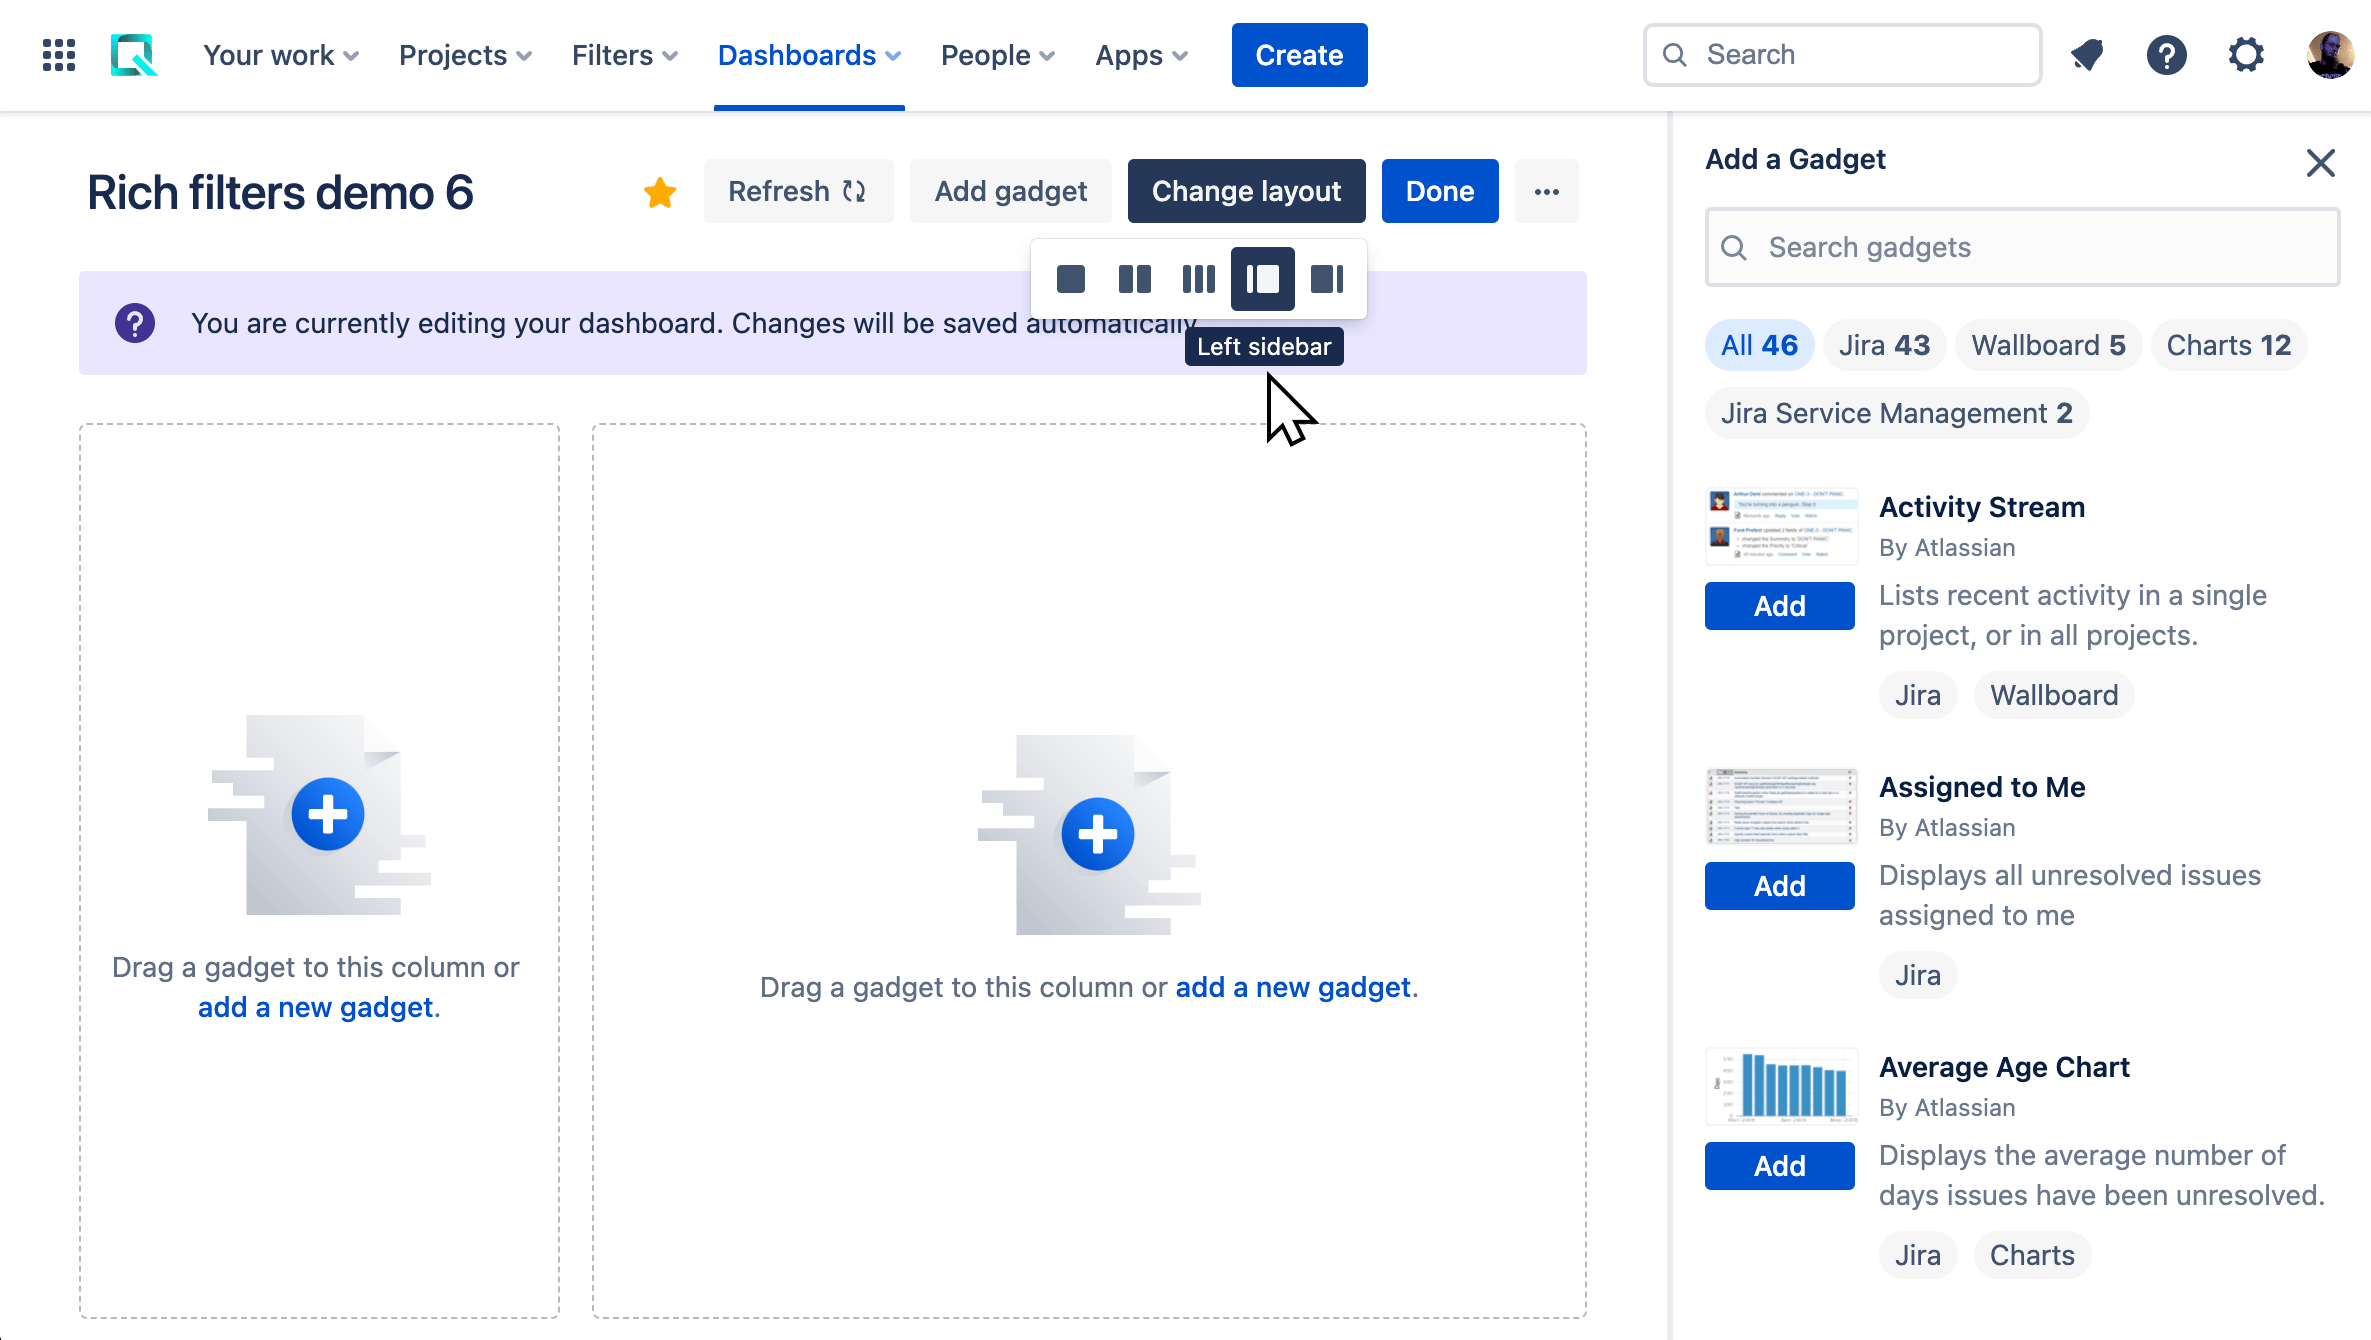
- Create a new dashboard (Dashboards > Create dashboard).
- Make sure it is using the Left sidebar layout. You can set this using the Change layout menu at the top of the dashboard.
- Add a Rich Filter Controller gadget to your dashboard based on your rich filter (Create a simple dashboard explains how to do this).
- After saving the configuration of your gadgets, make sure the controller is in the left column; drag and drop it if required.
If you want a more detailed explanation of creating a new dashboard, see Create a simple dashboard.
Your first custom value
Let's start by creating a custom value based on a time-tracking field. You'll create one called "Time Spent (h)" that sums total time spent working on your issues, based on the Time Spent Jira field, which has:
- A custom label and color.
- Custom formatting in hours (many people want an option to change Jira's default time formatting).
To do this:
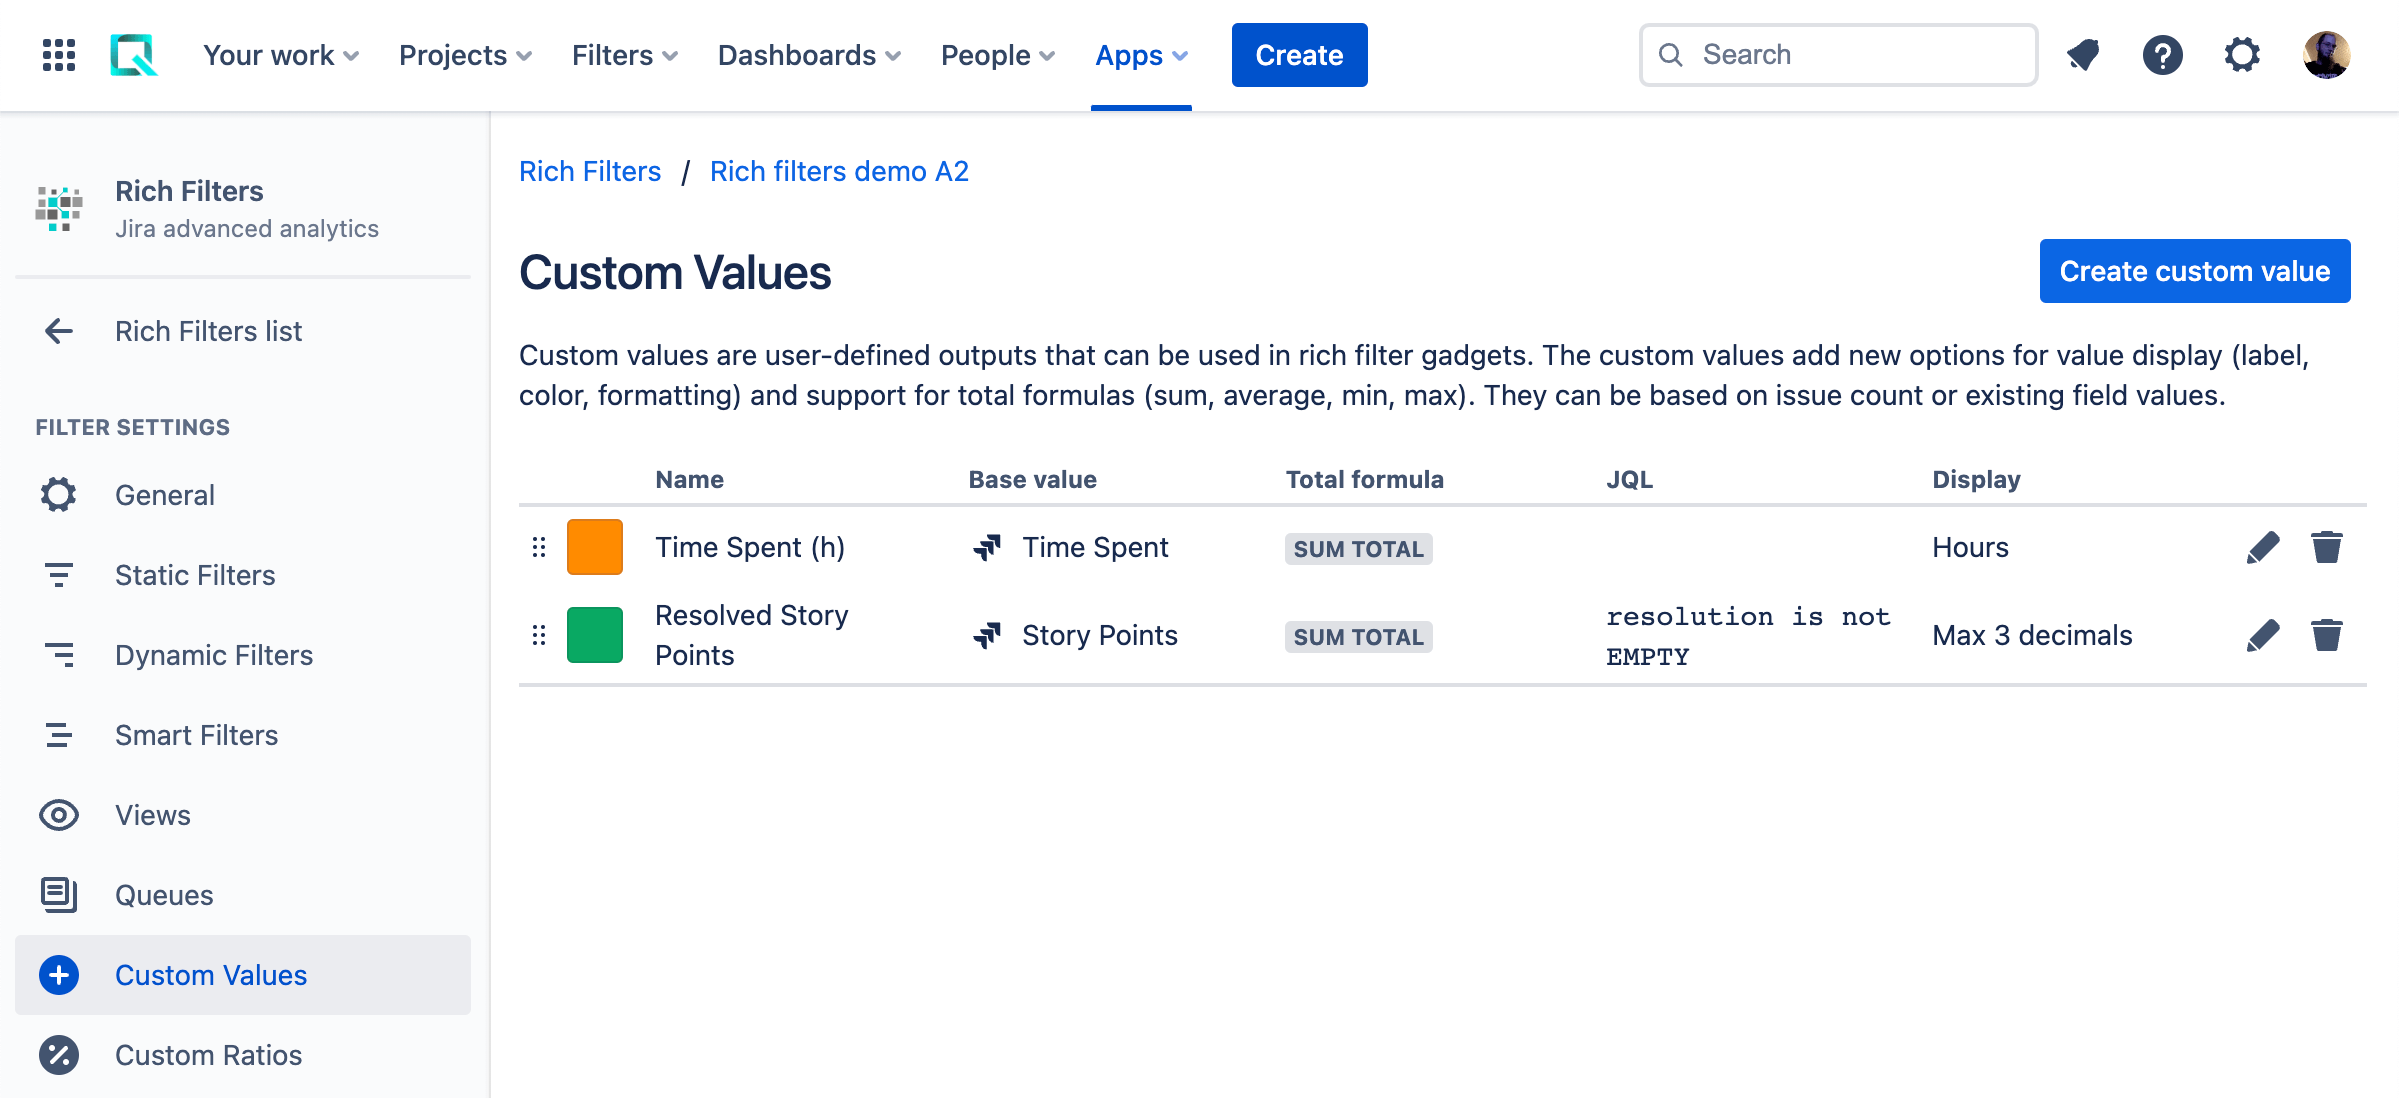
- Go back to your rich filter config and select the Custom Values tab.
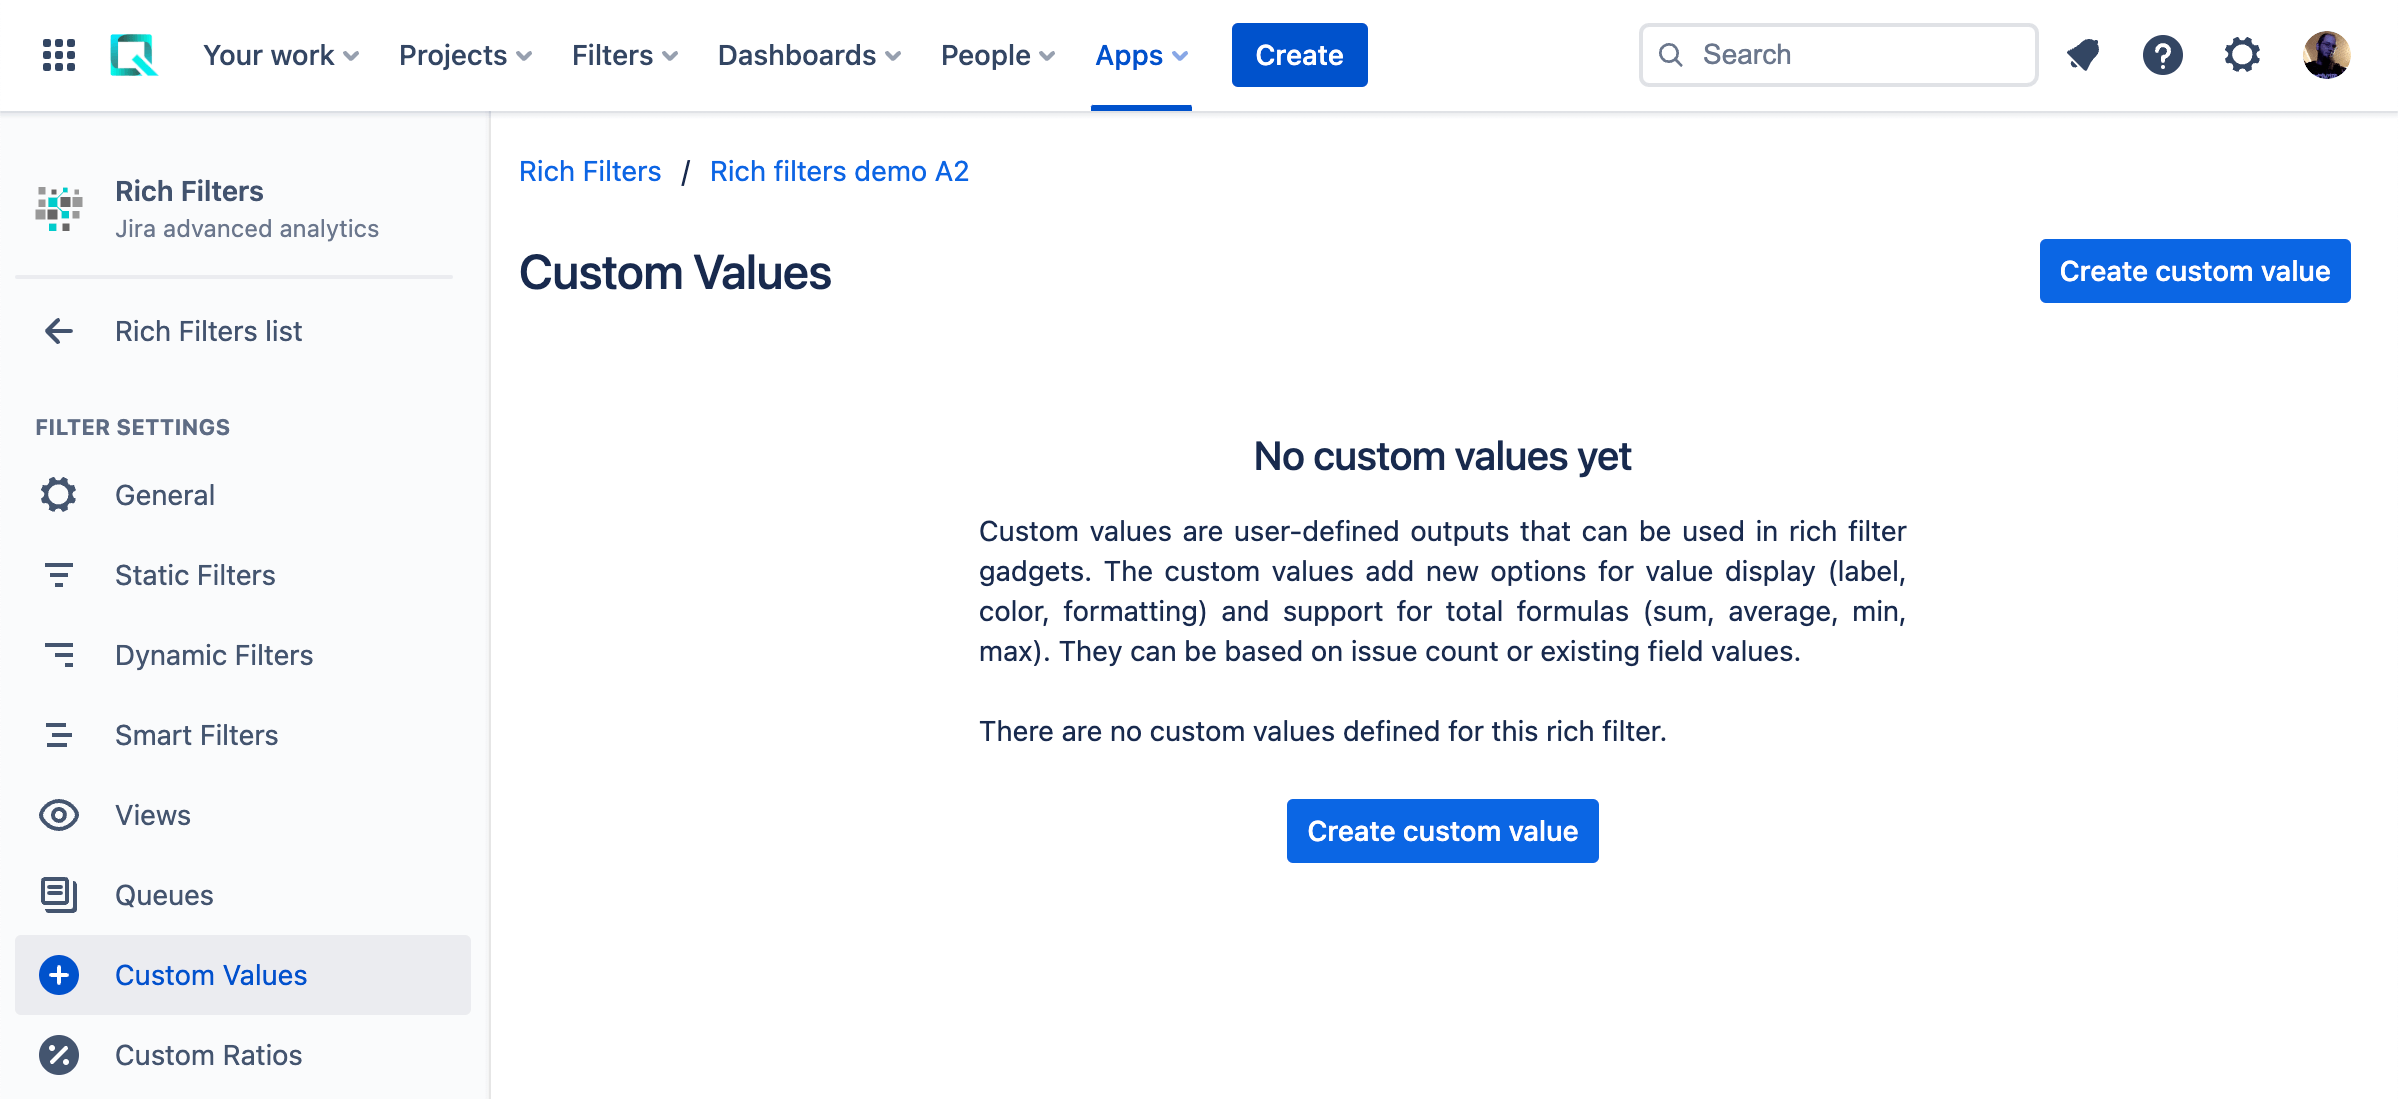
- Click Create custom value.
- In the resulting dialog box, enter the following values:
- Name: "Time Spent (h)". Also select a custom color from the color picker to the left of the entered name value. We've chosen orange.
- Base value: This is the Jira field you are basing your custom value on. Select Time Spent from the dropdown.
- Total formula: This is the formula used to calculate the totals shown when aggregating this custom value in gadgets (for example, the values shown in statistics and charts). Select Sum total — we want to show the total number of hours.
- Time display format: This gives you options for displaying time tracking fields in days, hours, minutes, or seconds, in addition to Jira's display format. Select Hours.
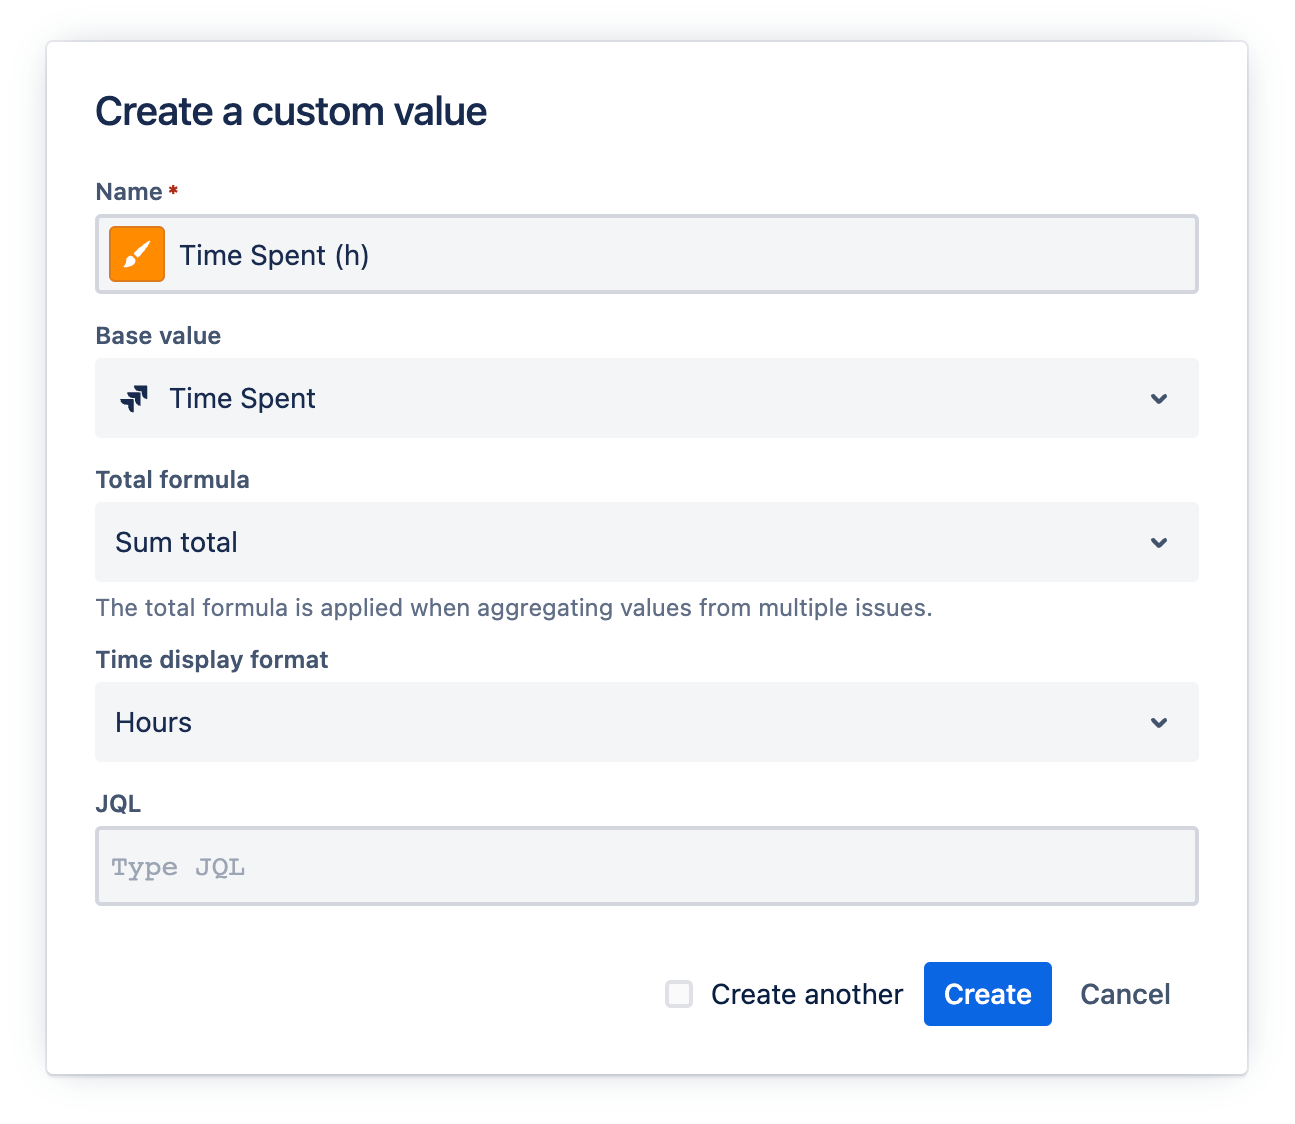
- Click Create.
At this point, your Custom Values tab should display a summary of the custom value you just created. You can edit or delete it using the pen and trash can buttons at the right-hand end of the row.
Numeric custom values
Now let's look at a numeric custom value; here you'll create a "Resolved Story Points" value, based on the Story Points Jira field, that uses a JQL query to provide the necessary filtering right inside the custom value itself.
- Create a new custom value with the following configuration values:
- Name: "Resolved Story Points". Give it a green color.
- Base value: Select Story Points from the dropdown.
- Total formula: Select Sum total.
- Decimals: This allows you to choose between showing no decimal portion in your values, a maximum number of decimal places, or an exact number of decimal places (with trailing zeros if required). Leave this at the default value.
- JQL: This is where you can enter a JQL query to filter the issues to which this custom value applies. We want to show resolved story points, therefore this custom value should apply only to resolved issues. To achieve this, insert "
resolution is not EMPTY" into this field.
- Click Create.
Display your custom value totals in counters and statistics gadgets
Now you've created some custom values, you need to actually use them somewhere.
First, you'll use a Rich Filter Simple Counters gadget to display some useful totals.
- Add a Rich Filter Simple Counters gadget to your dashboard (Create a simple dashboard explains how to add gadgets).
- If required, move the gadget to just below your controller gadget by dragging and dropping it.
- Configure the following fields in the gadget config form:
- Rich filter: Set this to your rich filter.
- Values: From the Pick a value... dropdown, select the Jira Issue Count value, and your custom Time Spent (h) and Resolved Story Points values.
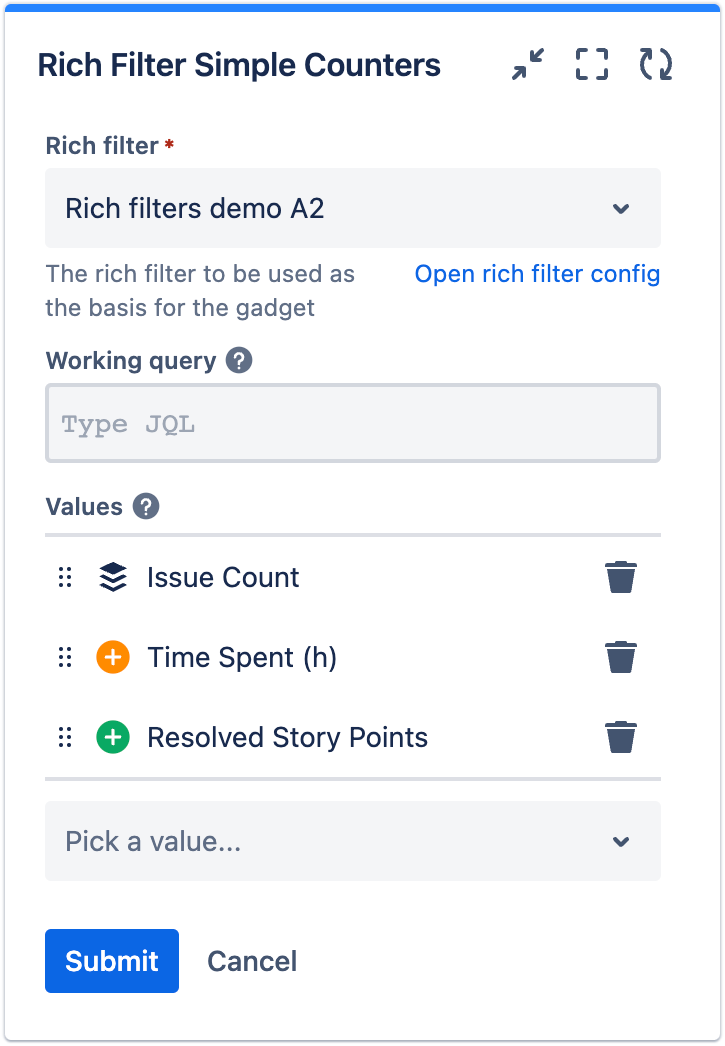
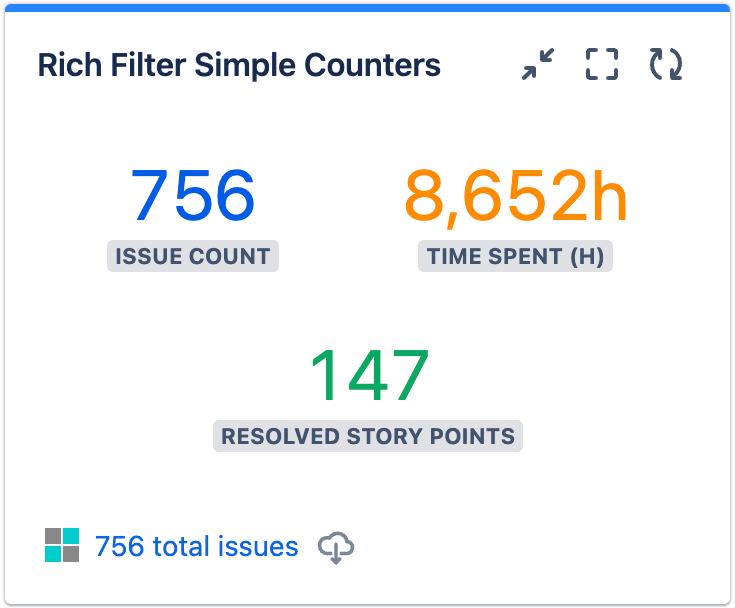
- Click Submit. Your Rich Filter Simple Counters gadget should look like so:
Now let's use a Rich Filter Statistics gadget to break down the same data further, showing these custom values for each assignee.
- Add a Rich Filter Statistics gadget to your dashboard.
- Move the gadget to the right-hand column by dragging and dropping it.
- There are several fields you should configure in the gadget config form:
- Rich filter: Set this to the same rich filter as your other gadgets.
- Breakdown by > Statistic type: Select Assignee from the dropdown.
- Values: Again, select Issue Count value, Time Spent (h), and Resolved Story Points.
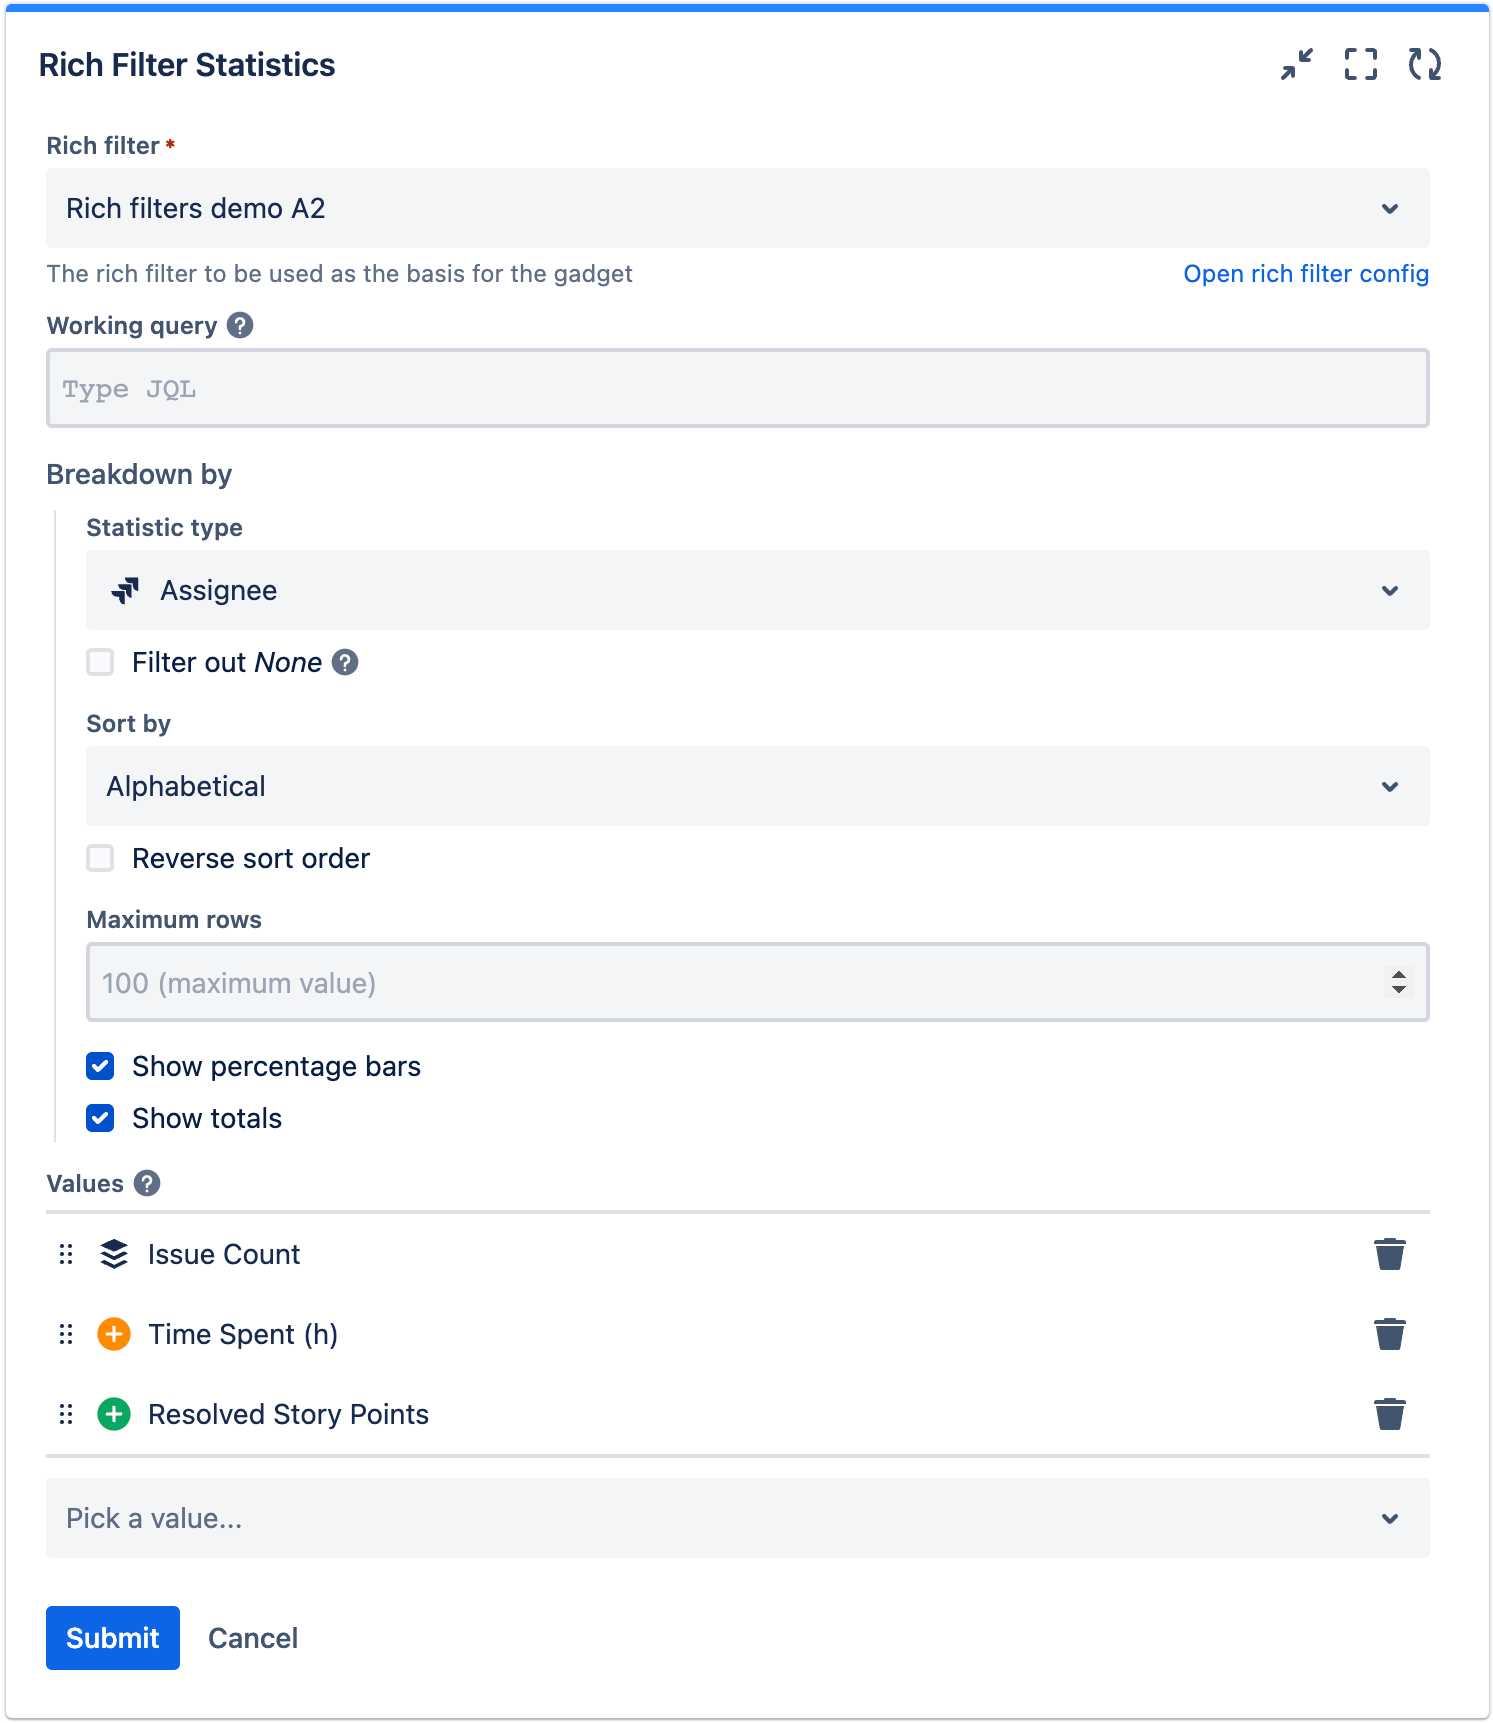
- Click Submit. Your Rich Filter Statistics gadget should look like so:
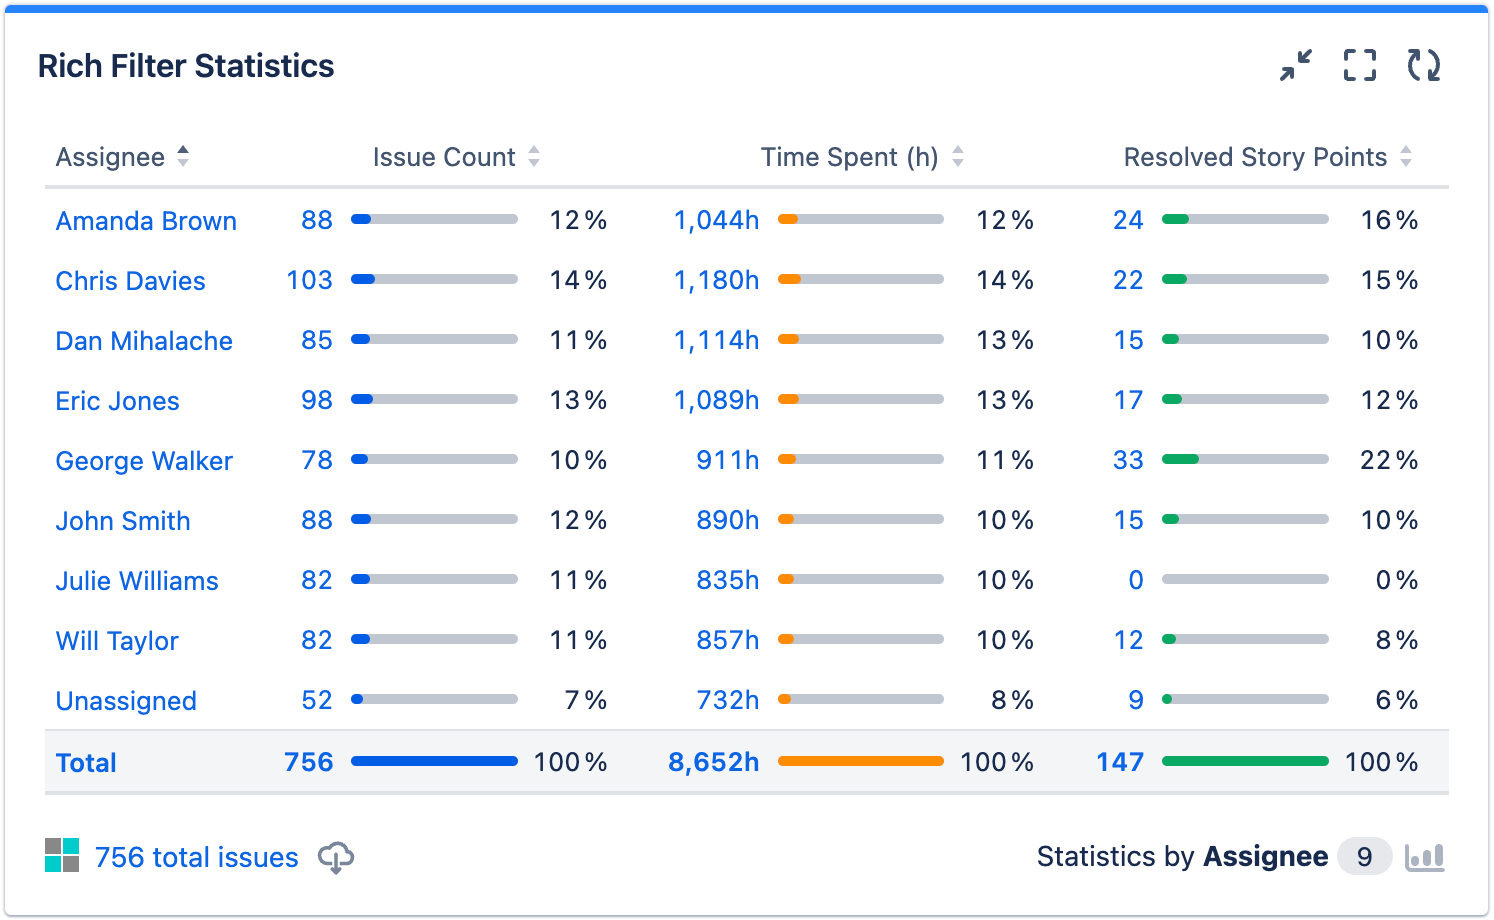
Before we move on, let's consider for a moment what we just did. We defined a notion of "Time Spent (h)" and started to use that instead of the native Time Spent field. This is preferable because it provides a custom time display in hours, and a custom label and color. We then defined a notion of "Resolved Story Points" that provides a useful filter on top of the native Story Points field and used that in our gadgets.
This has started to give you a glimpse into the power of custom values — you can define a custom value to suit your needs, and then use it everywhere. And you can do all this without being a Jira administrator. Let's continue.
Duration-based custom values
Let's explore creating some more advanced custom values based on computed durations provided by rich filters. We'll create new custom values based on the Issue age / resolution time calculated duration value. Issue age / resolution time brings two closely related values together in one. If an issue isn't resolved, the value will be Issue age — i.e the time that has passed since the issue was created, until now. If it is resolved, then the age will stop increasing on the resolution date, and the value will become a static resolution time value — i.e. the time between the created date and the resolution date.
We'll now create two new custom values based on Issue age/resolution time:
- Age, which will contain the age of issues, whether they have been resolved or not. You'll display this in a Rich Filter Results gadget view later on.
- Avg Resolution Time, which will contain the resolution time of issues, hence it will only be shown for resolved issues. This can then be used to display the average issue resolution time for each assignee in your Rich Filter Statistics gadget.
Let's do this:
- Go back to your rich filter config's Custom Values tab.
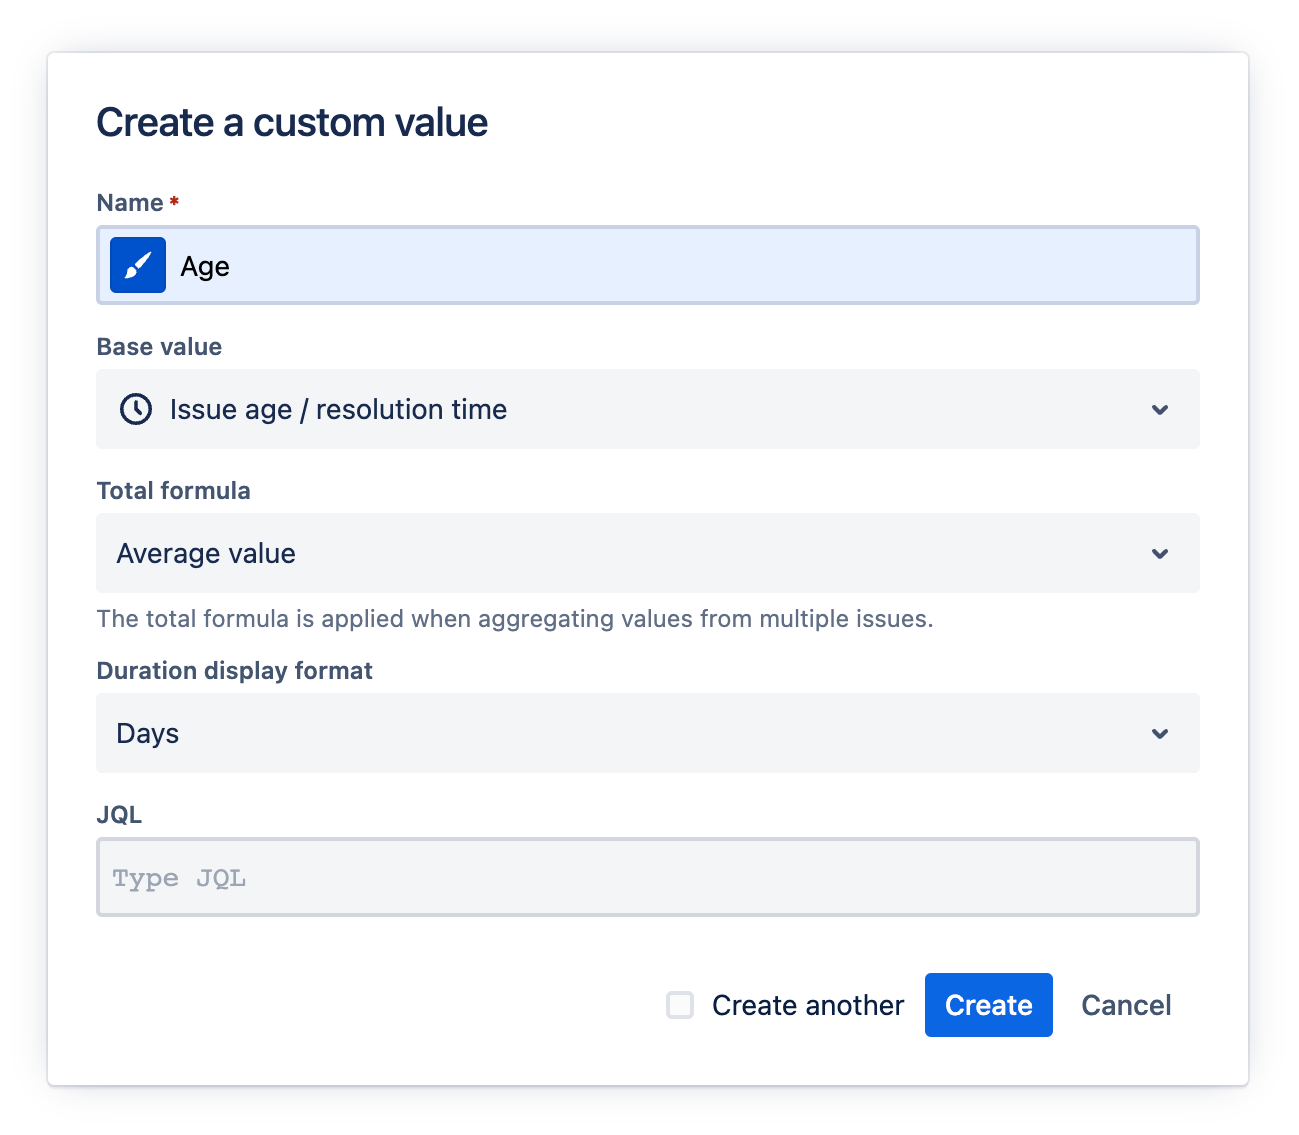
- Create a new custom value with the following configuration values (as illustrated in the picture above):
- Name: "Age". Give it a blue color.
- Base value: Select Issue age / resolution time.
- Total formula: Select Average Value.
- Duration display format: Select Days.
- Create another custom value, with the following configuration values:
- Name: "Avg Resolution Time". Give it a gray color.
- Base value: Select Issue age / resolution time.
- Total formula: Select Average Value.
- Duration display format: Select Days.
- JQL: Insert "
resolution is not EMPTY" — we want this custom value to apply only to resolved issues.
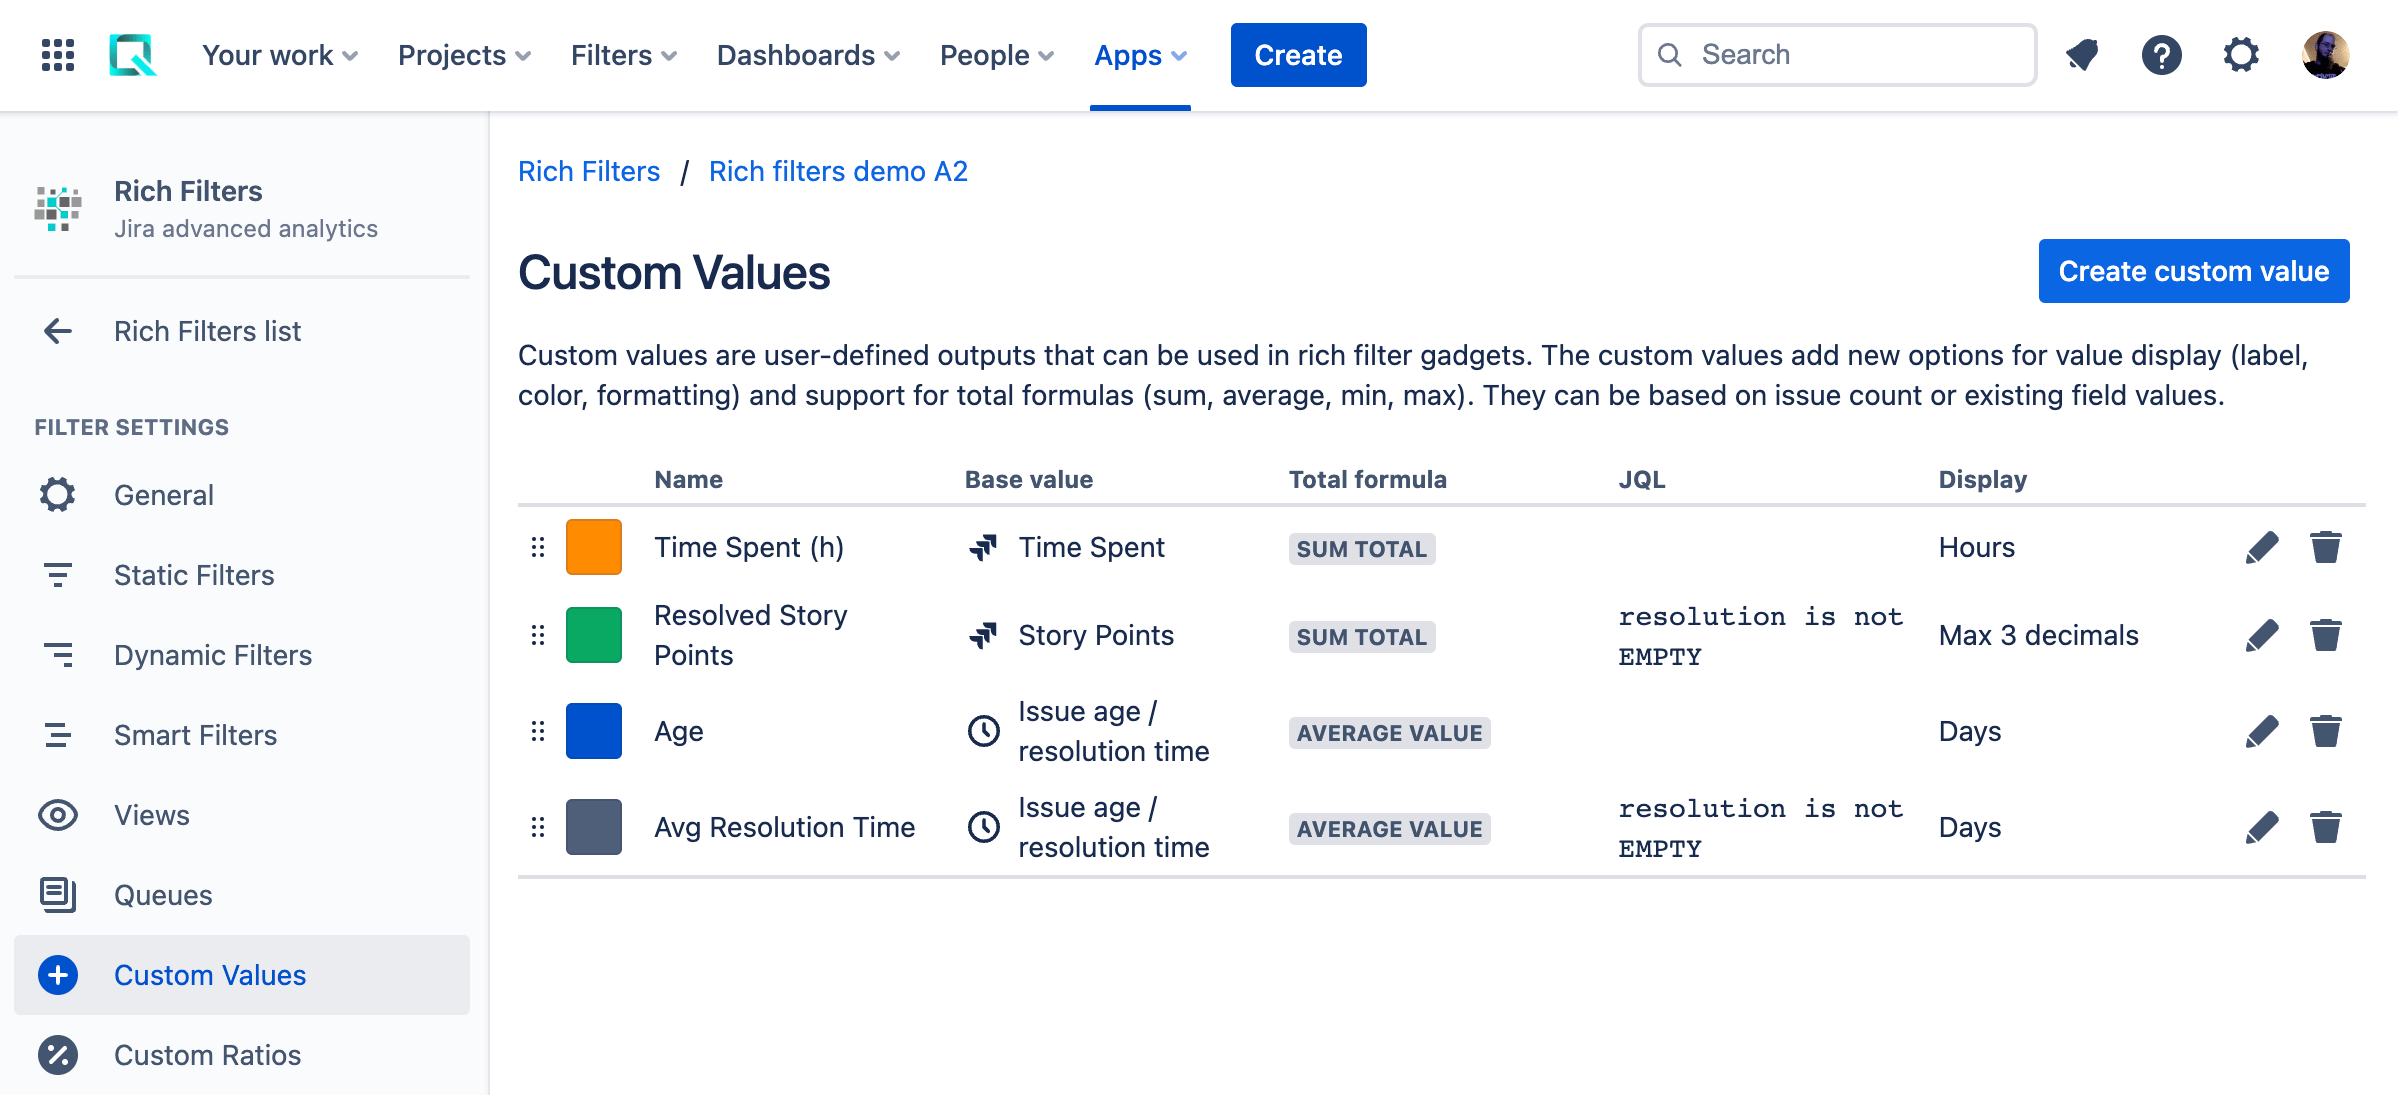
- Your Custom Values tab should now look like this. Check it before moving on:
Add Avg Resolution Time to your statistics
- On your dashboard, open your Rich Filter Statistics gadget config form (as described in Easier configuration with the Rich filter menu).
- Add your new Avg Resolution Time value in the Values section and click Submit.
- Your Rich Filter Statistics gadget should now look like this:
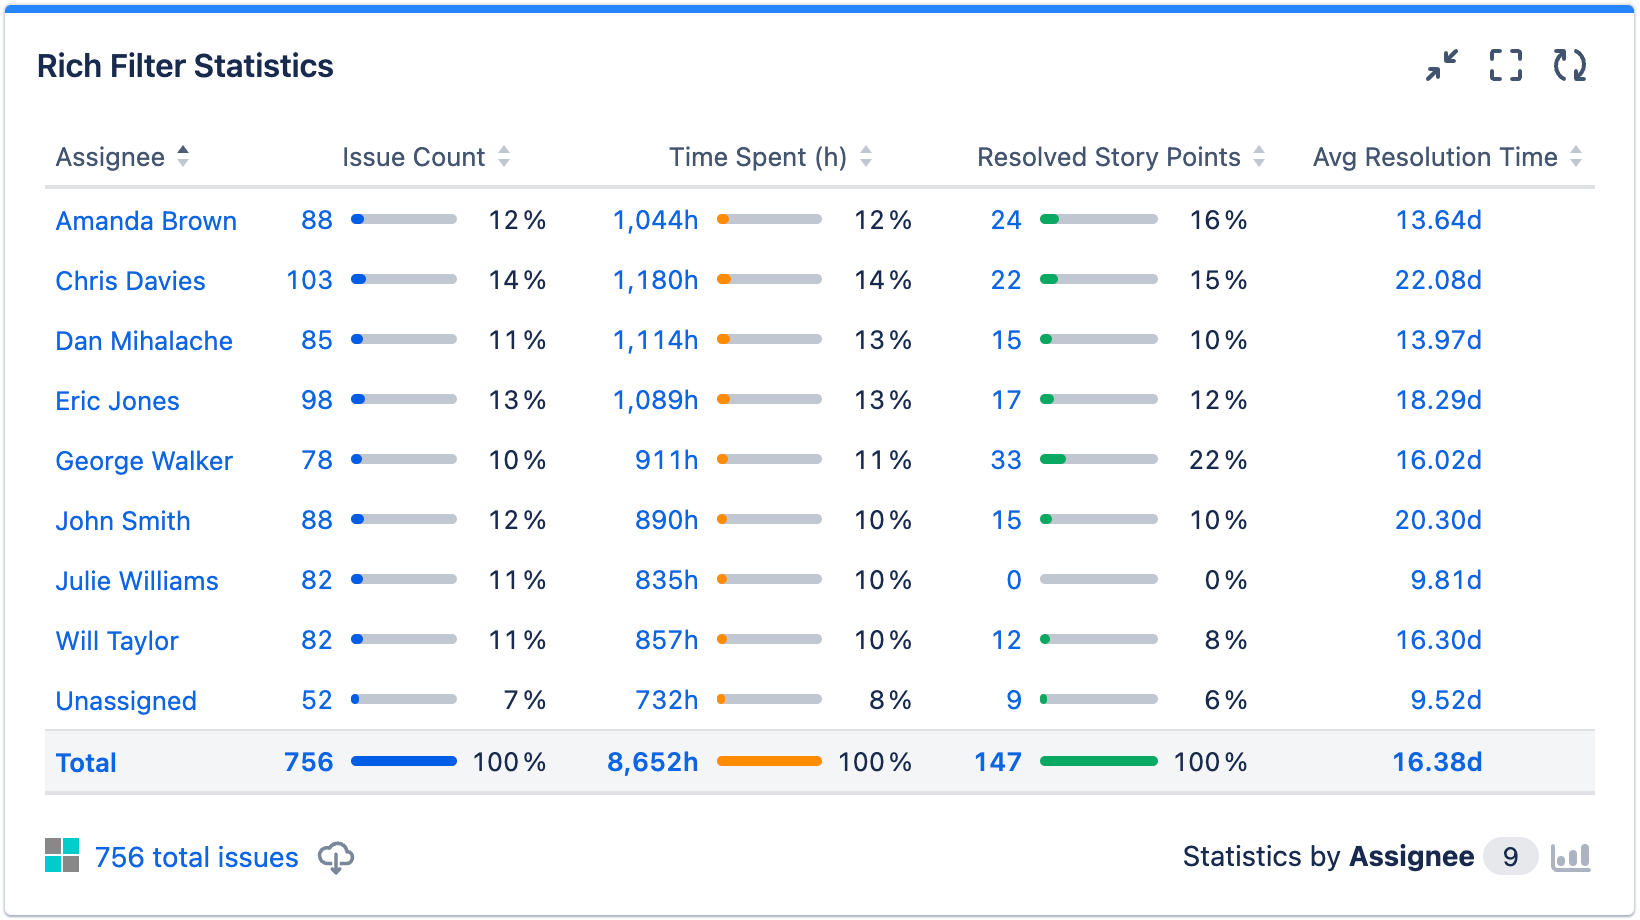
Now, the gadget also shows the average resolution time for each assignee. Note that in this case, the percentage bar is not displayed — it does not make sense for values using the average aggregation formula.
Display custom values in a results gadget
Let's display some custom values as columns in a Rich Filter Results gadget.
To be able to do that, you'll first need to set up a View to display those columns.
- Open your rich filter config (as described in Easier configuration with the Rich filter menu).
- Select the Views tab.
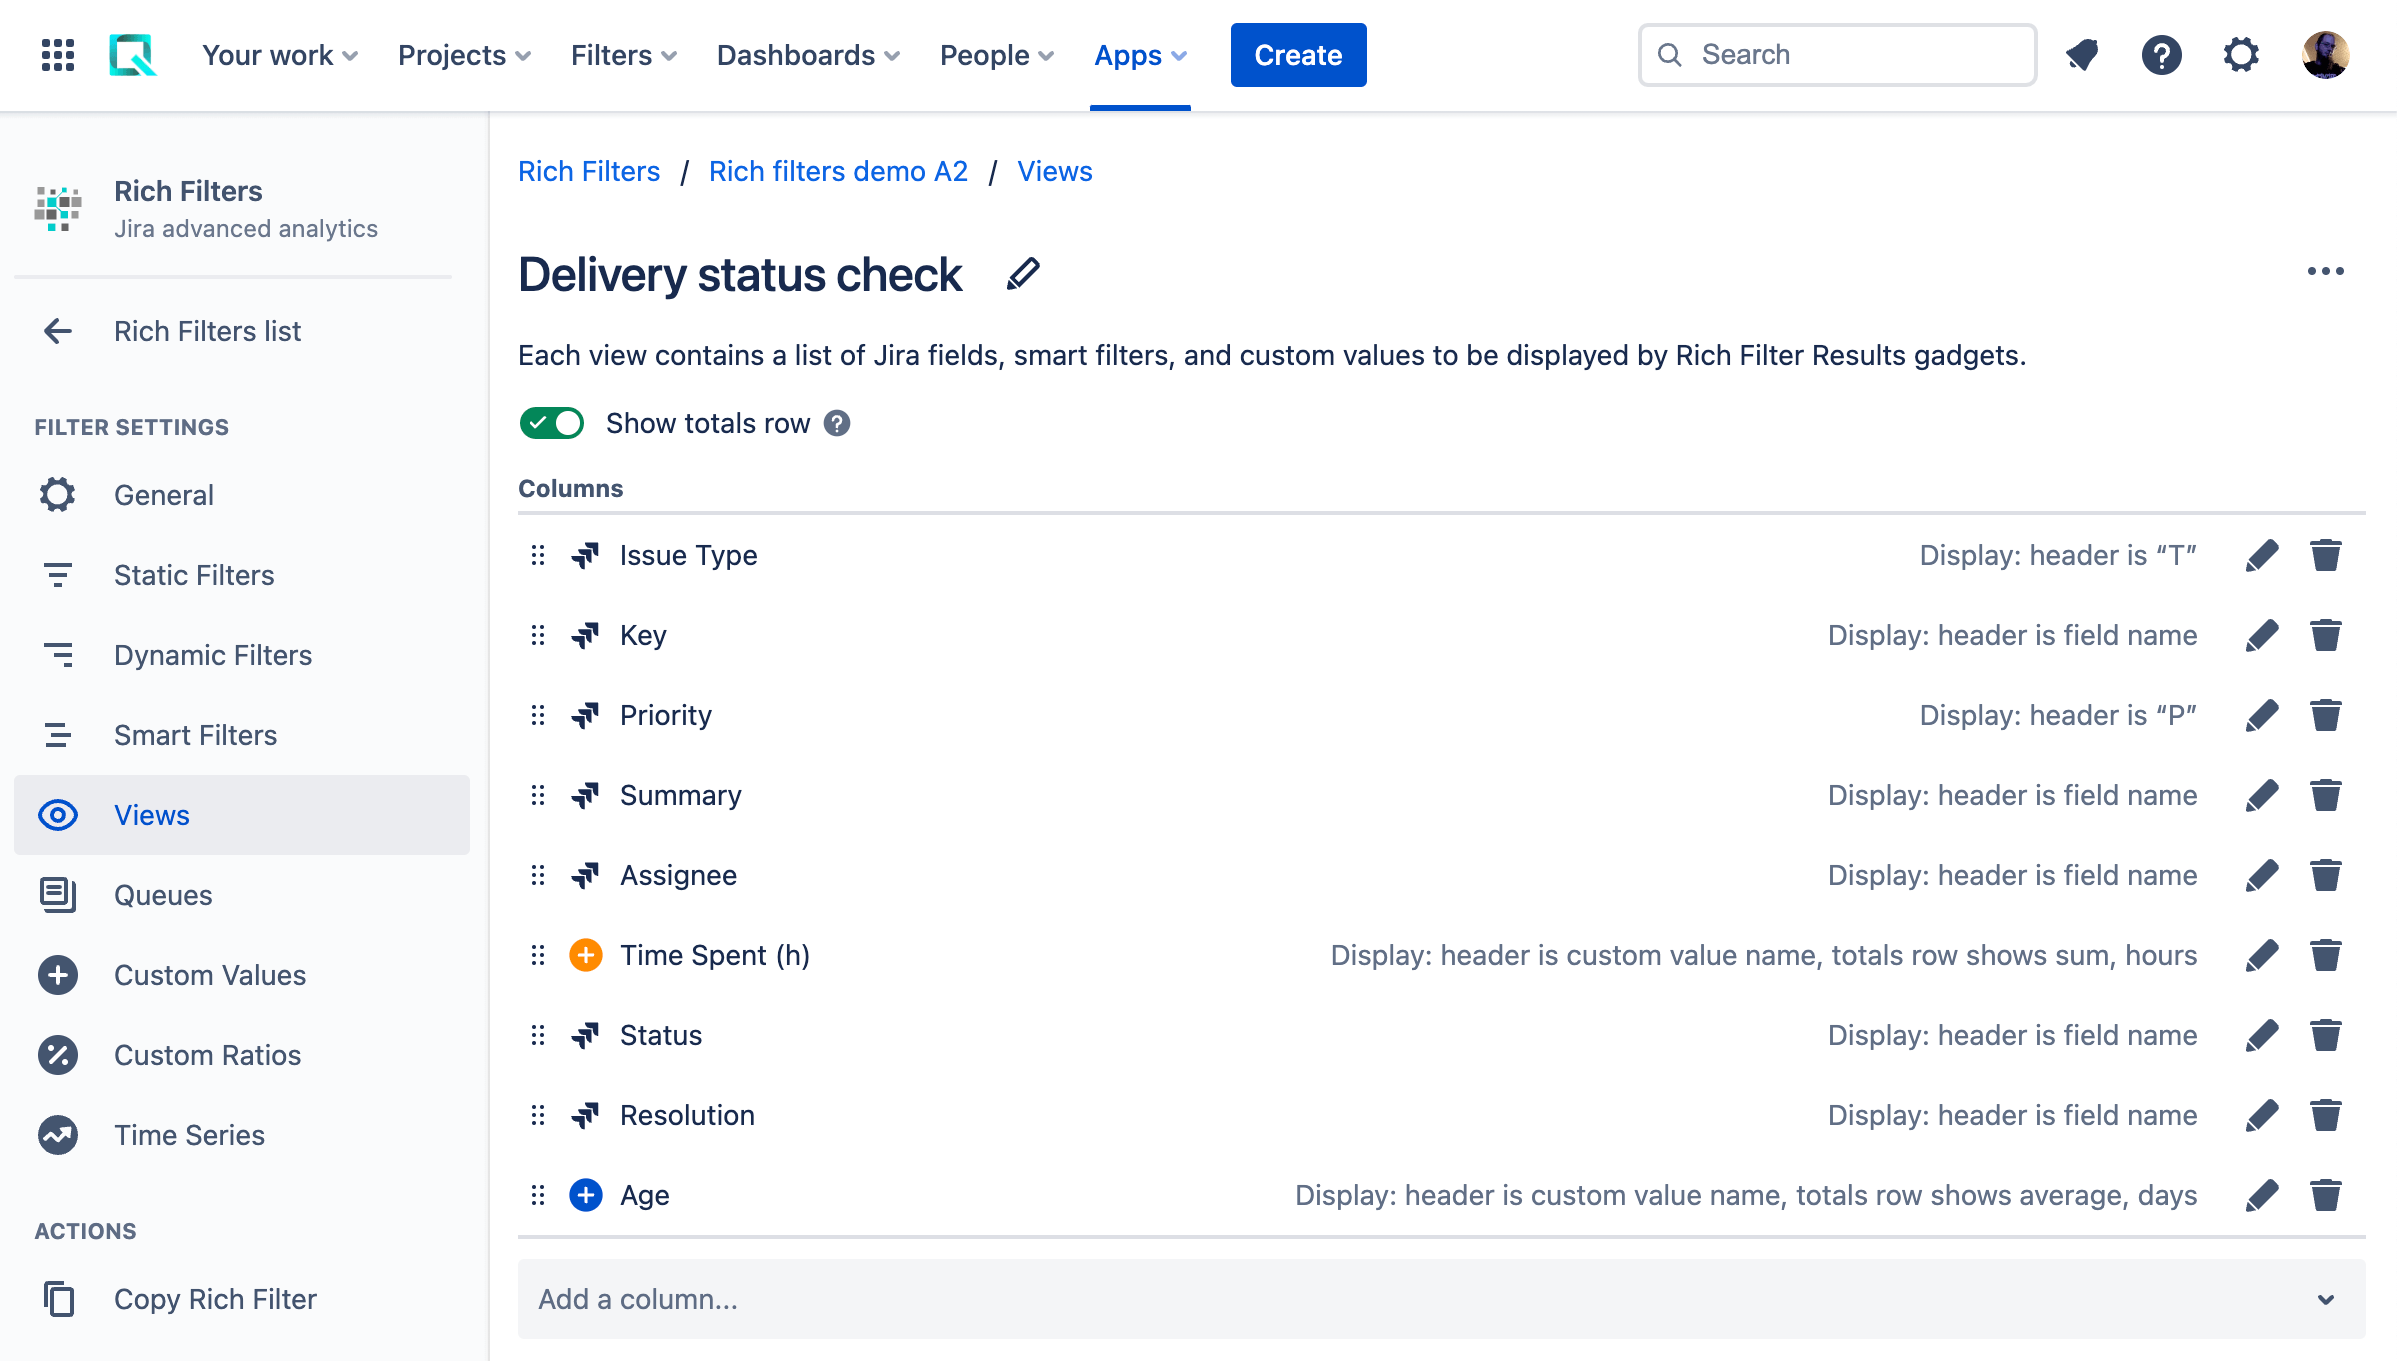
- Add a view called "Delivery status check".
- Inside Delivery status check, add the columns Issue Type, Key, Priority, Summary, Assignee, Time Spent (h), Status, Resolution, and Age. We've chosen custom values that make sense to display in Rich Filter Results gadget columns.
- Turn your attention to the Show totals row toggle switch above the columns list. Click the toggle to turn this on — a Rich Filter Results gadget will now display this view with a Total row at the bottom containing the totals for all the value columns in the view, including the custom value columns.
In the same way as the other columns, you can edit the display of your custom value columns using the edit (pen) icons on the right-hand side of the display, for example to customize the column headings.
Your Delivery status check config should look like this:
Now it's time to show your new view inside a Rich Filter Results gadget.
- Add a Rich Filter Results gadget to your dashboard.
- Move the gadget to the right-hand column below the Rich Filter Statistics gadget, by dragging and dropping it.
- In the gadget config form, set the Rich filter to the same rich filter as your other gadgets, and click Submit. Your Rich Filter Results gadget should look like so:
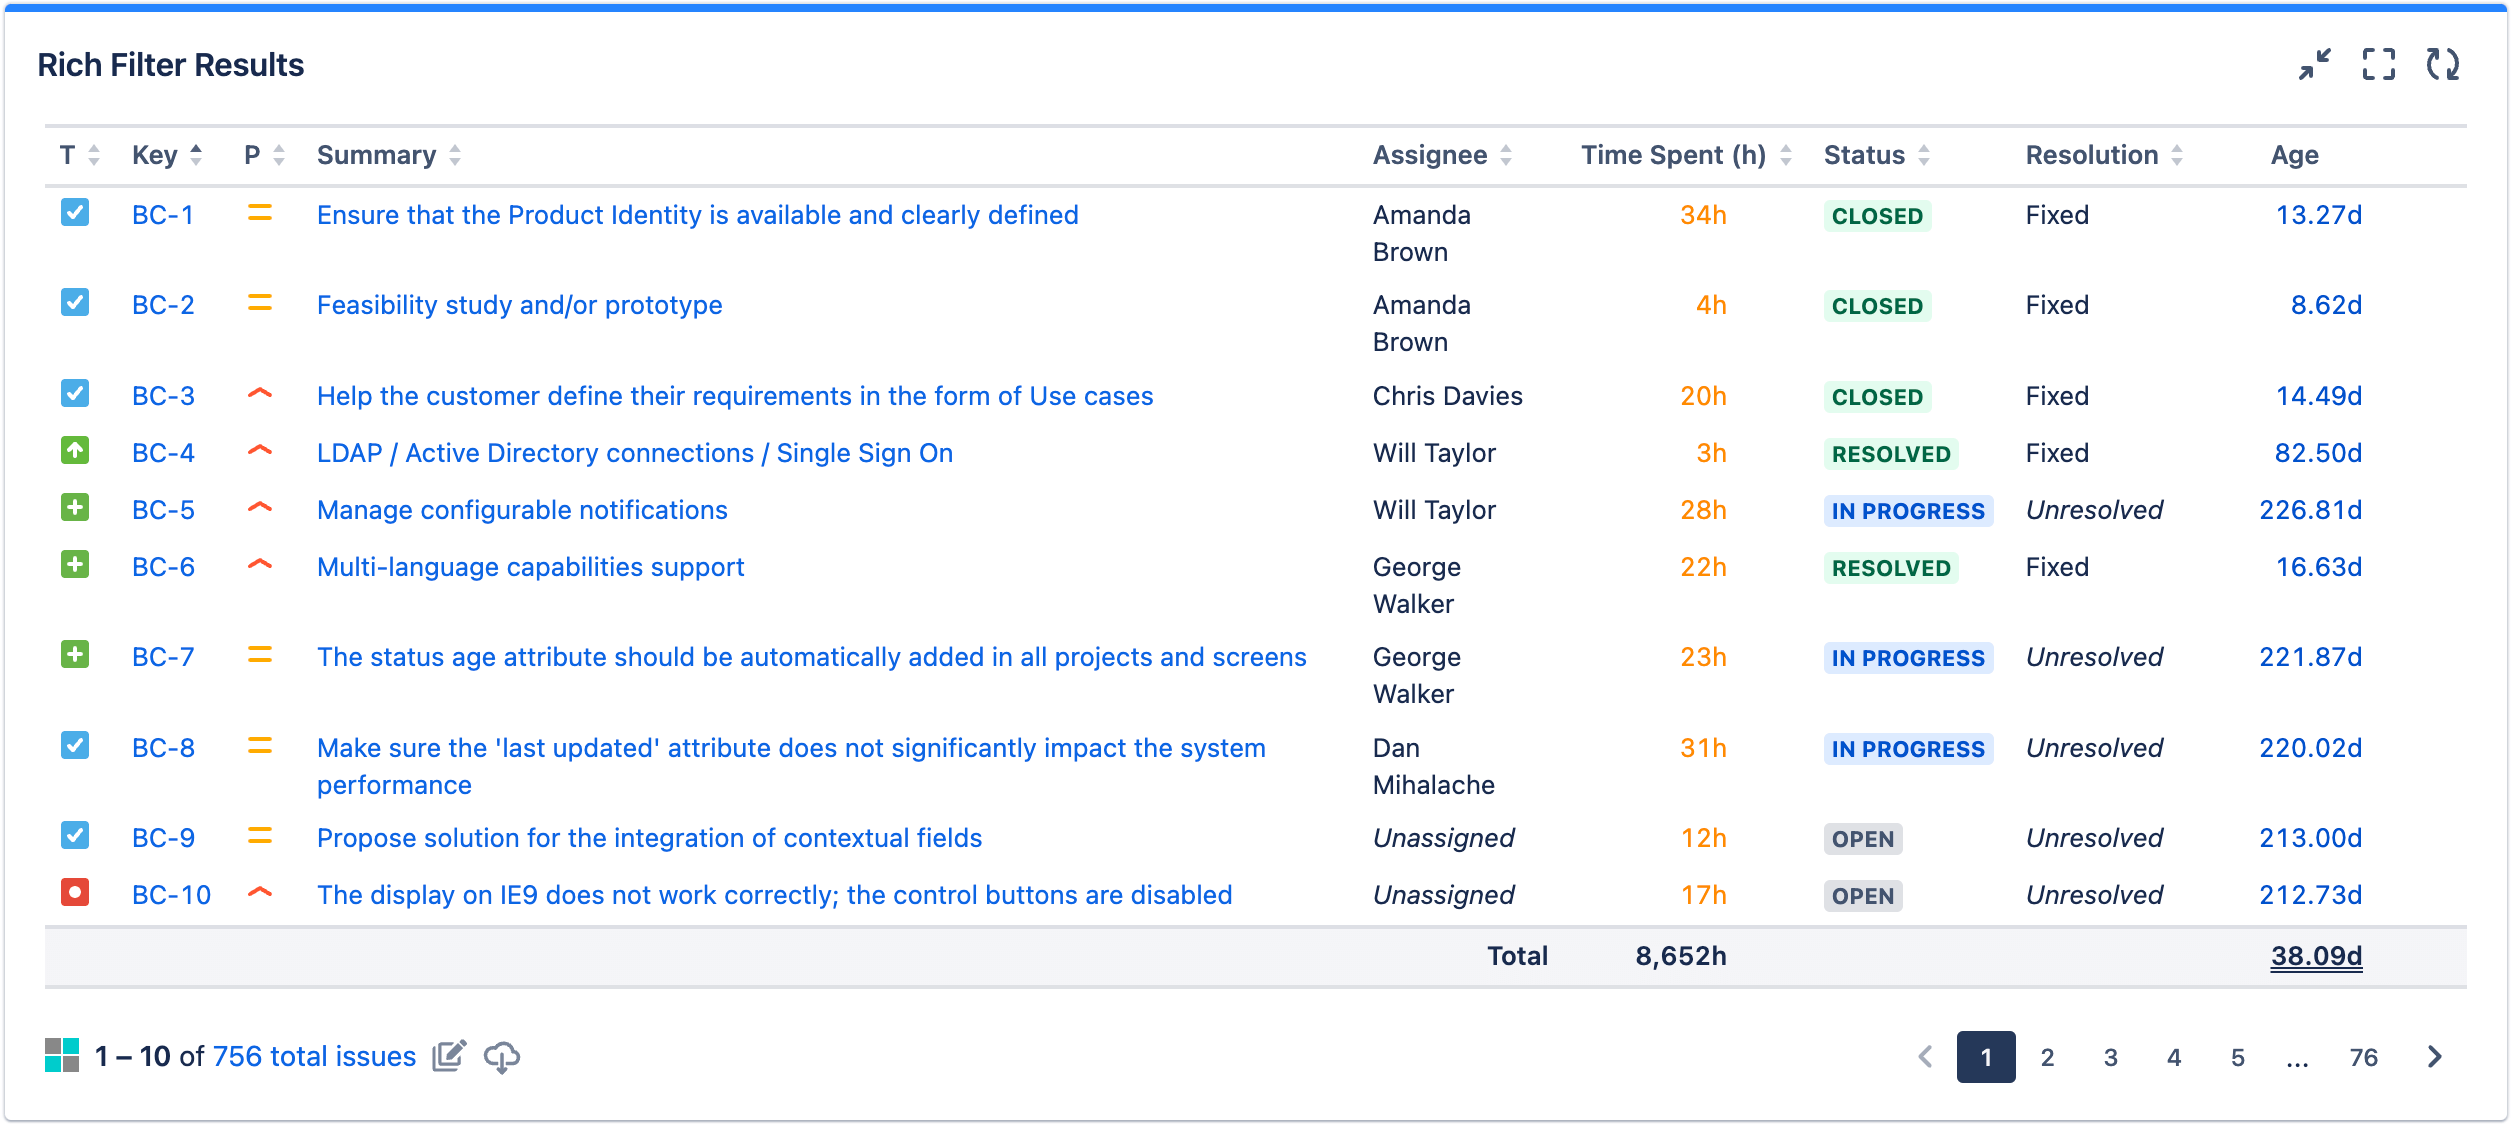
Have a look at the columns based on your custom values. Note the Total row, which displays totals for your custom values calculated according to the Total formula setting you specified for each one.
Create a custom value based on a custom duration
Now we will create a Due In custom value that shows how far away the deadline for each issue is. This will be based on Custom duration — this is a special advanced base value that allows you to select a start and an end time/date from a list of options (which includes the current time), with the final value being the computed duration between the two.
Let's look at how this works:
- Go back to your rich filter config's Custom Values tab.
- Create another custom value with the following configuration values:
- Name: "Due In". Give it a red color.
- Base value: Select Custom duration from the dropdown. This causes two additional dropdown fields to appear to allow you to specify your start and end values:
- Start: Select Current time.
- End: Select Due date.
- Total formula: Select Minimum value. When aggregating this custom value on multiple issues, we'd like to see the one which is due next: the minimum Due In value.
- Duration display format: For the chosen Start and End values, this field is fixed at Days — non fractional.
- JQL: Insert "
resolution is EMPTY". It makes no sense to show Due In values for issues that are resolved.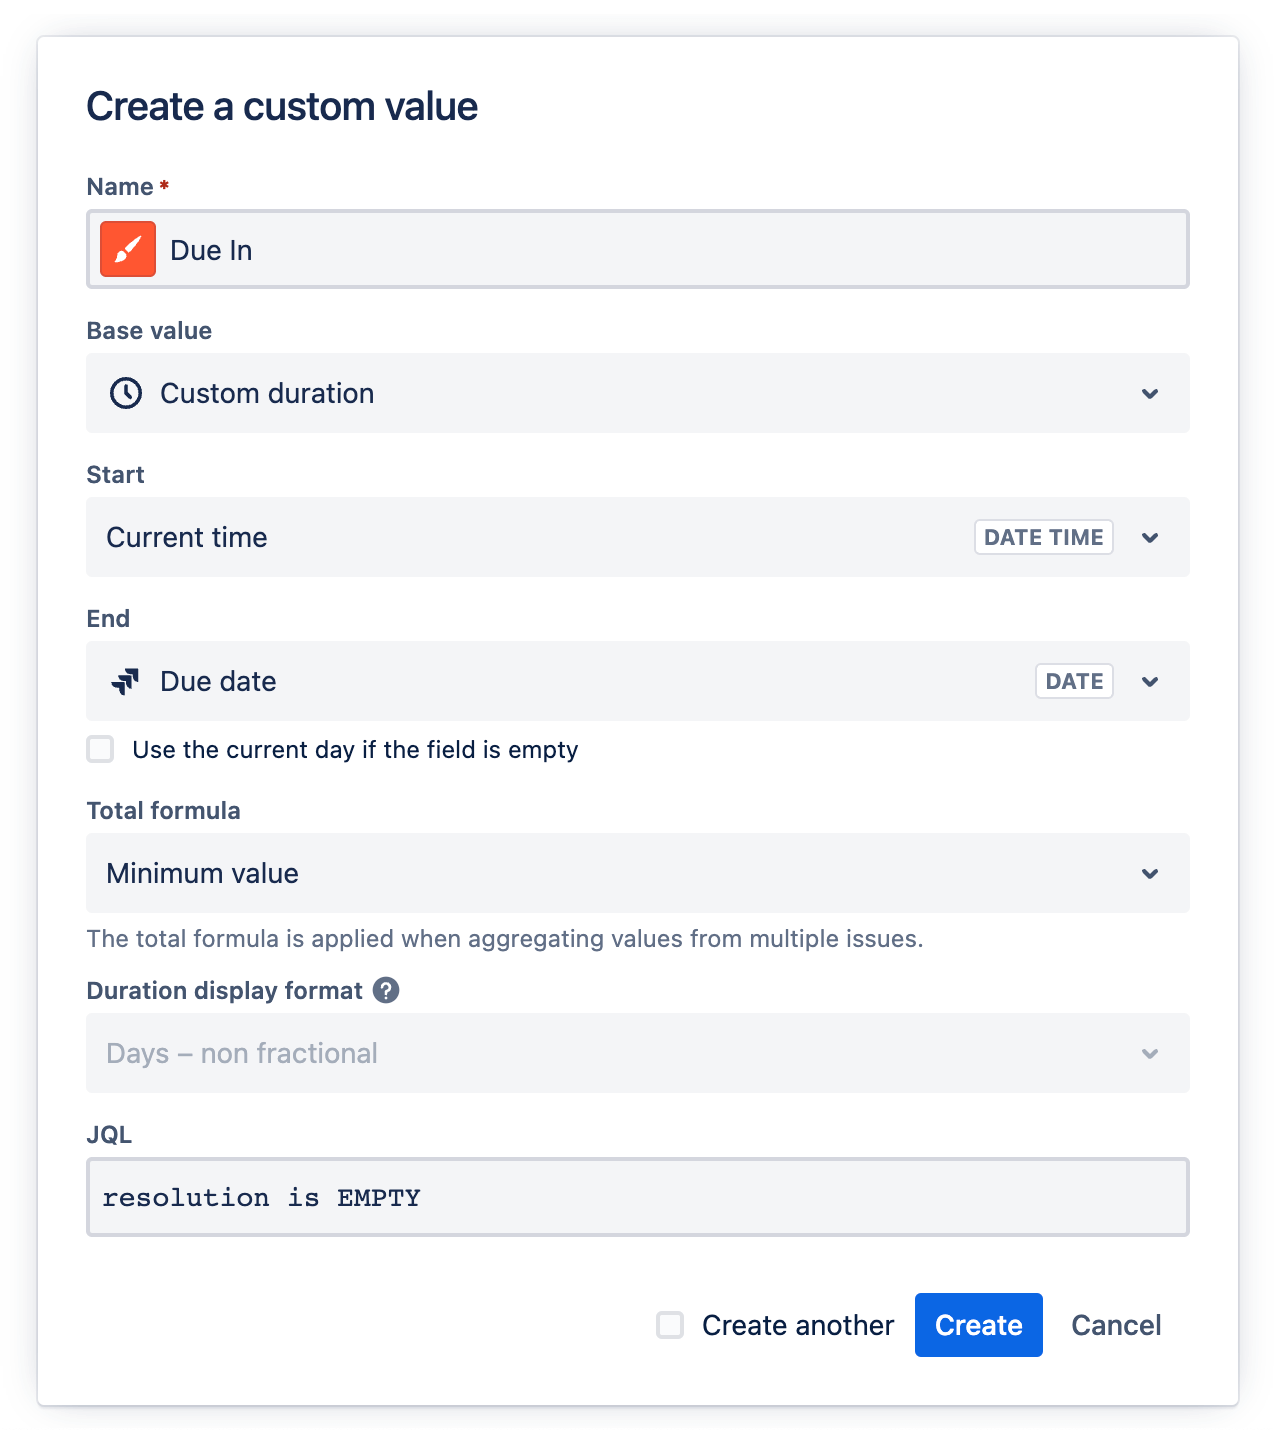
- Go back to your rich filter config's Views tab.
- In the Delivery status check view, add a new Due In column, and drag and drop it so it sits in between the Summary and Assignee columns.
- Go back to your dashboard and refresh it. You should see your Due In column in action:
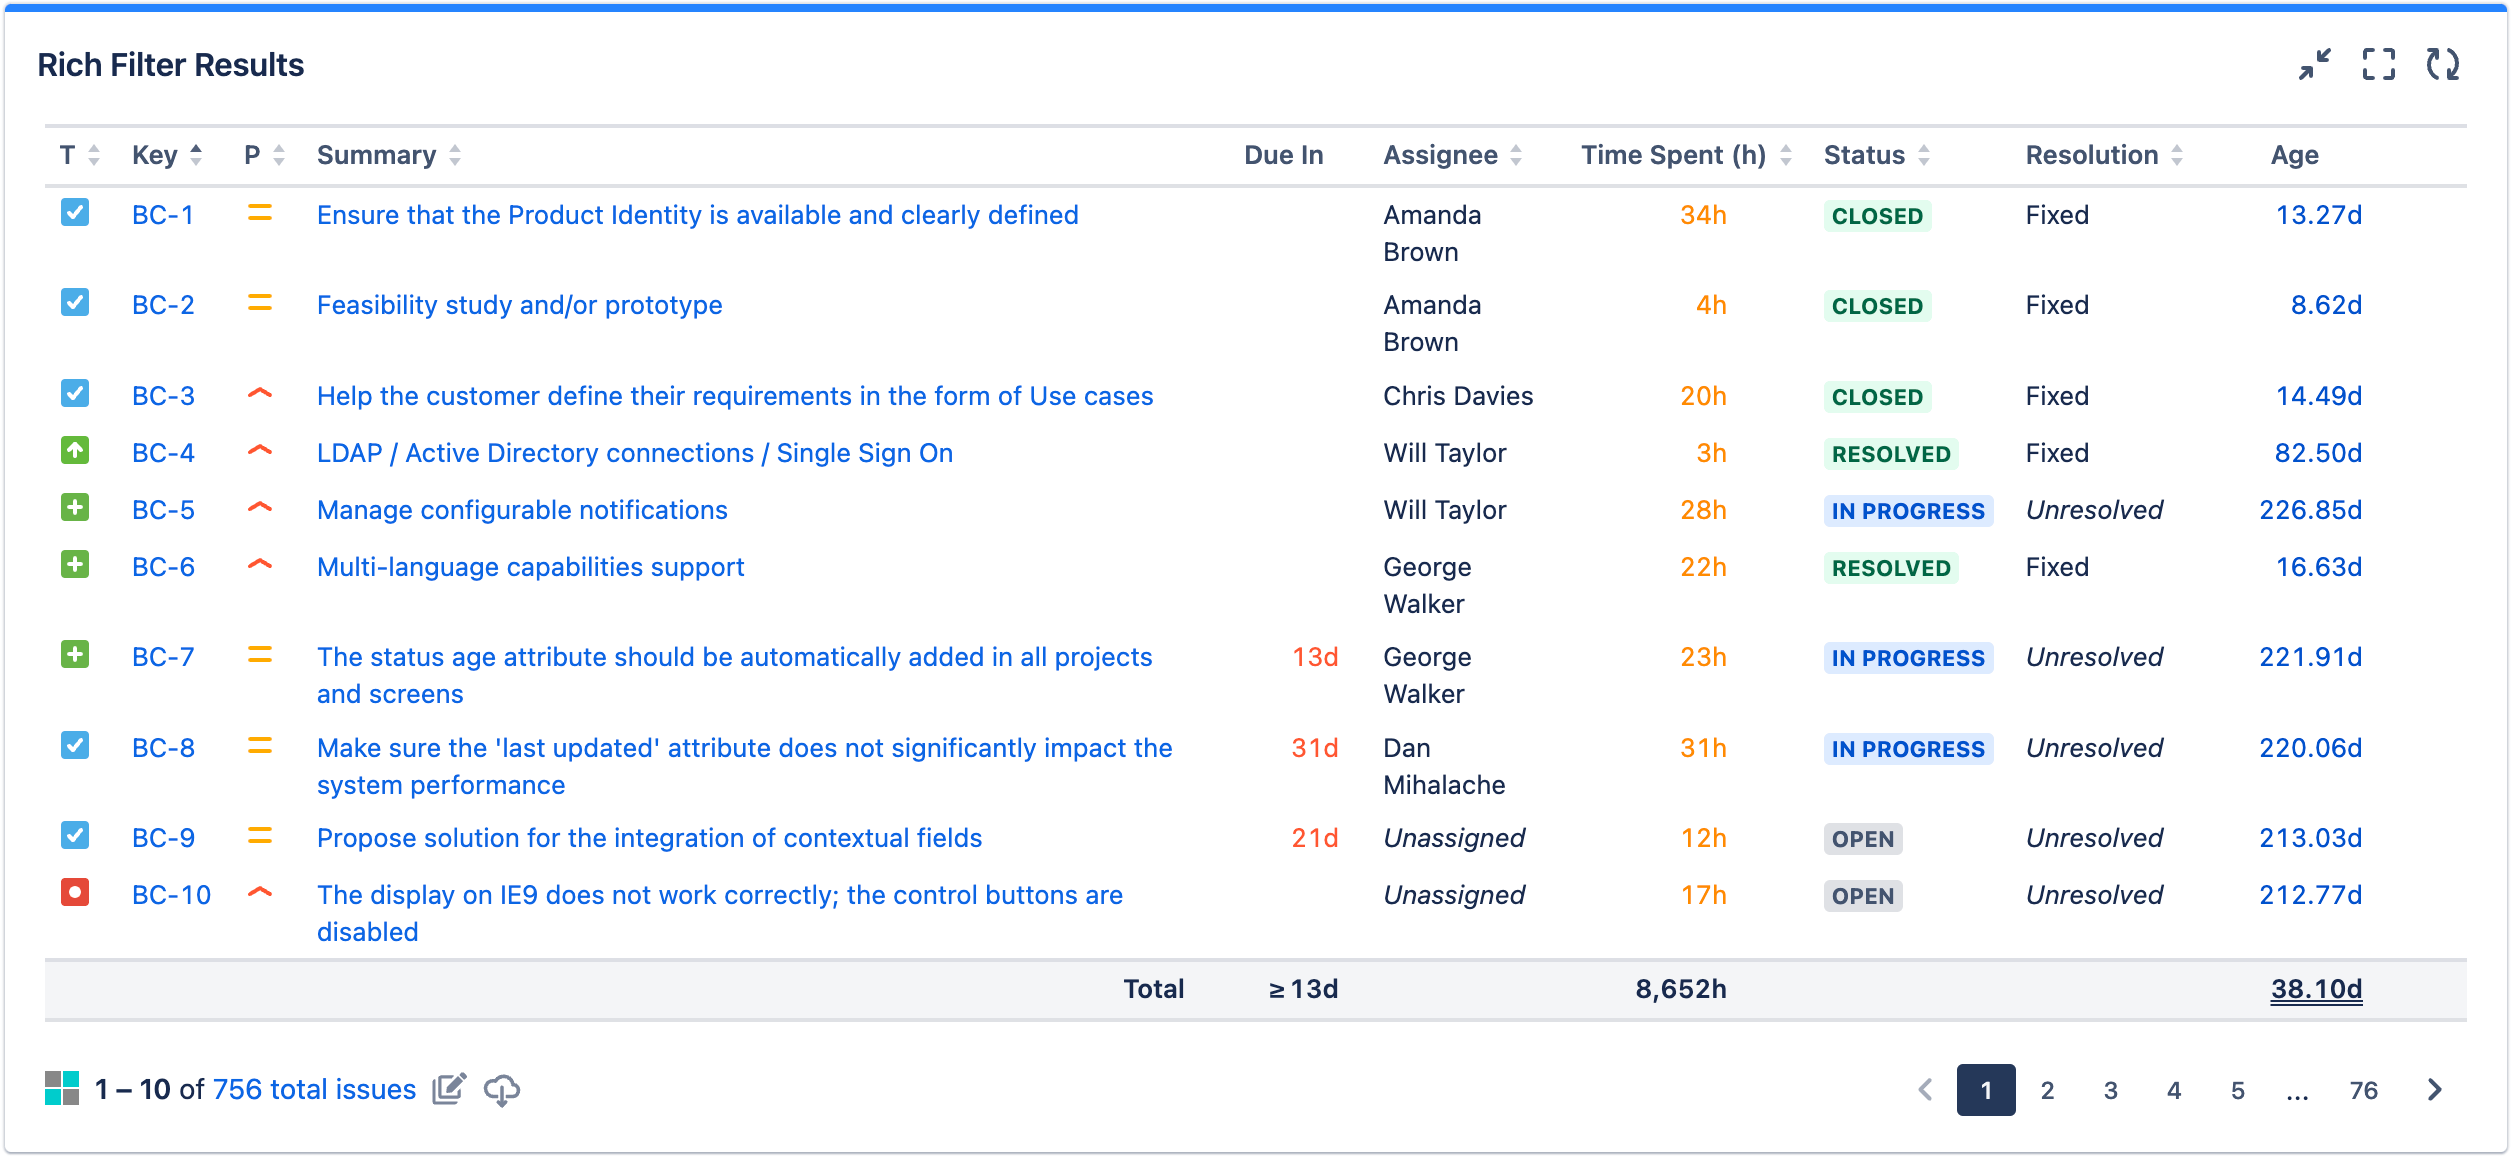
The Total row value for Due In is particularly interesting — because you selected Minimum Value for the Total formula, this acts as a useful signal of when the next task is due for completion.
Further exercises
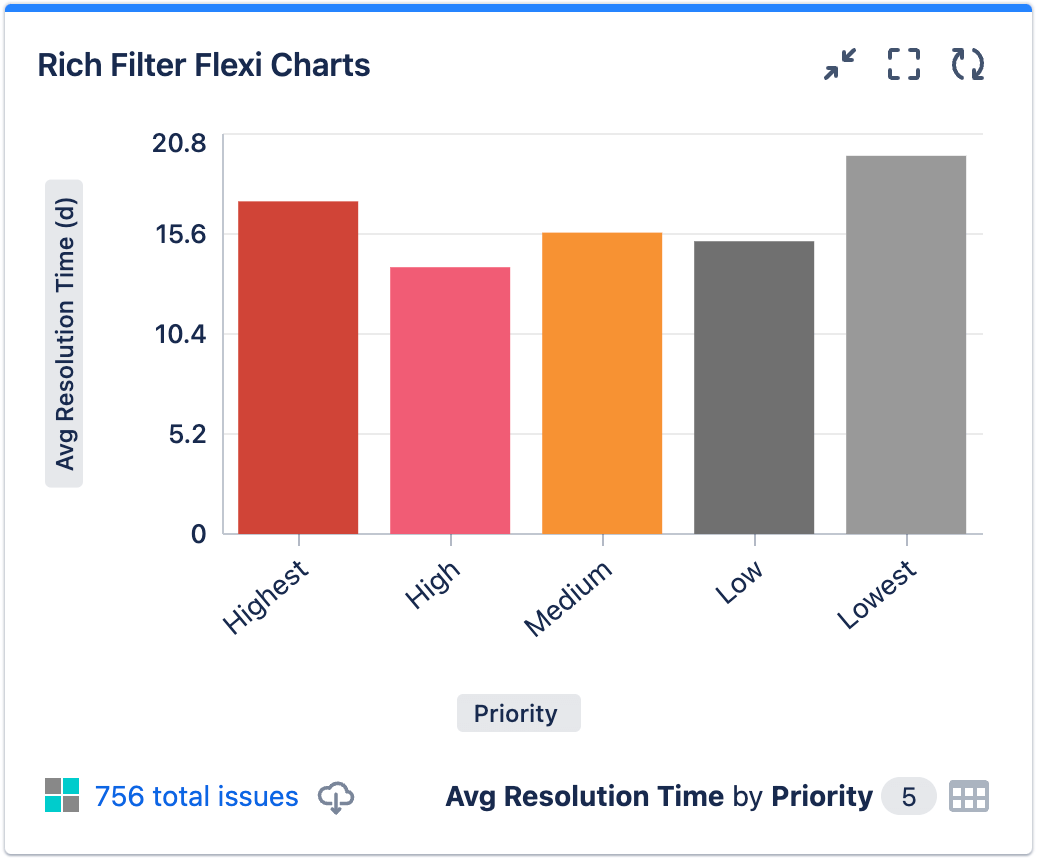
To complete this tutorial, we'd like you to create a bar flexi chart that shows the Avg Resolution Time for each Priority.
Your finished chart should look something like this:
We'd also recommend that you add some filters to your controller to provide additional interactive filtering of the issues shown in your gadgets:
- Add static filters as described in Get started with Rich Filters for Jira Dashboards.
- Add dynamic filters as described in Enhance your Jira dashboards with dynamic filters.
- Add a Teams smart filter as described in Create a Teams smart filter.
- Update your previous flexi chart to use your new smart filter as the Statistic type – this will allow you to display the Average Resolution Time by Team.