This page relates to the Cloud version of Rich Filters for Jira Dashboards. Please see the documentation index for Server & Data Center versions.
Add smart filters and smart columns to your dashboard
Smart filters are another type of filter that you can define in rich filters and use in dashboards. By the end of this tutorial you will be able to add (to Rich Filter Controller gadgets) drop-down buttons which allow you to filter issues by criteria you have defined. You will also be able to display (in Rich Filter Results gadgets) computed columns (we call these smart columns) based on the same criteria.

For this tutorial you need to already have created:
- a rich filter
- a dashboard with one Rich Filter Controller gadget and at least one Rich Filter Filter Results gadget based on your rich filter.
We have used the dashboard we worked with in the previous tutorial.
On this page:
Add smart filters
- Open the configuration page of your rich filter as described in the first tutorial.
- Click on the Smart Filters menu entry on the left side of the screen.

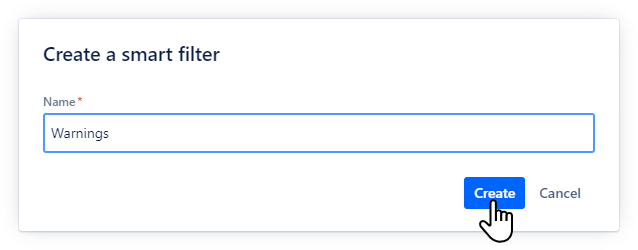
- Create a new smart filter named Warnings by clicking on the Create smart filter button at the top right of the screen and entering the name in the dialog box.
Add the three clauses below by clicking on the Create smart clause button at the top right of the screen and entering the name and the JQL in the dialog box for each clause.
Name JQL Top Priority priority in (1,2) and status = OpenPast Due Date duedate < now() and status != ClosedNo Due Date duedate = EMPTY and status not in (Resolved, Closed)

- Change the colors of the smart clauses as shown below:

- Open (or refresh) the dashboard which is based on your rich filter, or build a new one. You'll notice that the smart filter containing the three options you have configured is displayed in the Rich Filter Controller gadget.

If you select options in the smart filter and then click on Apply filters, the other gadgets in the dashboard which are based on the same rich filter will be updated to display only the issues which satisfy the JQL conditions of the selected options (the JQL conditions are ORed if more than one option is selected).
Add smart columns
- Open the configuration page of your rich filter and click on the Views menu entry on the left side of the screen.
- In the Requester view, you'll notice that it is now possible to add the smart filter to be displayed as a computed column (we call this a smart column). Add the Warnings smart column to the view.

- Refresh the dashboard. You'll notice that the Requester view of the Rich Filter Results gadget now has a new column with the header Warnings, displaying labels in colored rectangles for the corresponding issues, as configured in the smart filter clauses.

- Go back to the Smart Filters section of your rich filter configuration page. Create a new smart filter called Risk and add a clause with the name On and the JQL
priority in (1,2) and assignee is EMPTY
- Go to the Views section of your rich filter. In the Delivery view add the smart column Risk that you have just created.
- Drag & drop the Risk smart column after the Priority column.

- Edit the Risk smart column by clicking on the corresponding icon.

- Select Show tags as = Colors Only and Column Heading = Smart filter initials (we want this column to be as compact as possible), then click on Update.

- Refresh the dashboard. In the Rich Filter Controller gadget, select the option Top Priority in the smart filter Warnings and click on Apply filters. You'll notice that the Rich Filter Results gadget displays only the issues which satisfy the JQL condition of the Top Priority clause (
priority in (1,2) and status = Open) and that in the Delivery view, next to the Priority field, a new column with the header R displays color tags for the at-risk issues (priority in (1,2) and assignee is EMPTY).
Smart filters are a very powerful mechanism which allows you to create complex filtering options, to add computed columns to your views, and to highlight issues using color tags.
Learn More
To learn more about smart filters, have a look at Configuring Smart Filters.
For the next tutorial, continue to Add Rich Filter Statistics gadgets to your dashboard.